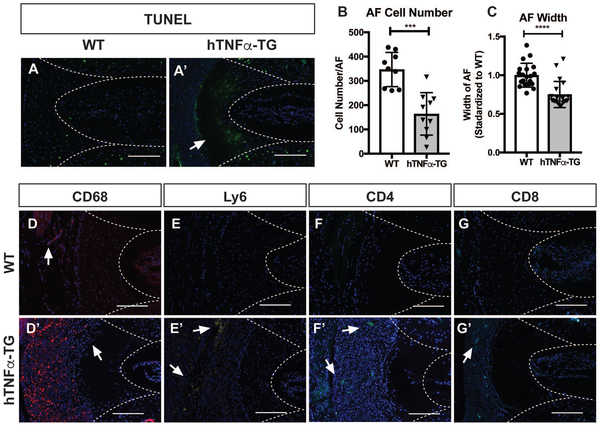
Figure 4: hTNFα-TG mice evidence a vigorous inflammatory response adjacent to the caudal AF accompanied by AF cell loss and reduced AF width.
TUNEL staining of (A) WT and (A’) hTNFα-TG caudal levels. (B) Quantification of AF cellularity by counting the number of nuclei on DAPI stained sections. (C) Quantification of AF width measured from Safranin O/Fast Green/Hematoxylin stained images. (D-G’) Representative immunofluorescence staining of caudal discs from WT and hTNFα-TG mice showing elevated immune cell staining of (D,D’) CD68 a phagocytic macrophage marker, (E,E’) Ly6 a neutrophil marker, and (F-G’) both CD4 and CD8 T-cell markers. Quantitative data was plotted as mean ± SD and differences between groups were analyzed using t-test. *** p ≤ 0.001, **** p ≤ 0.0001 Staining was performed on 5 animals/genotype and representative images are shown. Scale bar = 200μm.

