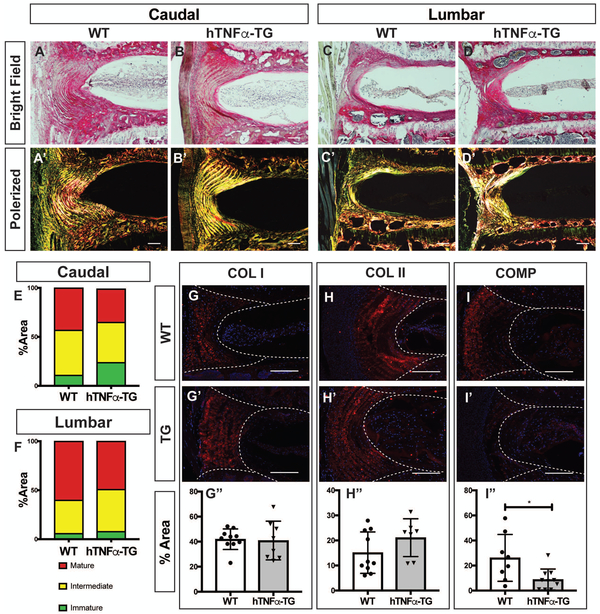
Figure 5: hTNFα-TG mice show no difference in AF collagens but have reduction in cartilage oligomeric matrix protein.
(A-D’) Picrosirius red staining of (A-B’) caudal and (C-D’) lumbar discs showing collagen organization in the annulus fibrosus. Collagen fibers visualized under polarized light (A’, B’, C’, and D’) show organized lamellae (scale bar 50 μm). (E, F) Quantification of the fiber content distribution in (E) caudal and (F) lumbar levels showing no significant difference in fiber maturity distribution (n = 5 animals/genotype). Representative images of immunofluorescence staining of disc and quantification showed comparable expression of (G) caudal collagen I (COL I), (H) caudal collagen II (COL II), and a reduction in (I) cartilage oligomeric matrix protein (COMP) levels of hTNFα-TG mice. Staining was performed on 5 animals/genotype and 1-2 levels per animal; A-D’ scale bar = 100μm; G-I’ scale bar = 200μm. Significance between fiber distribution was determined using χ2 test and differences between immunofluorescence staining data plotted as mean ± SD was analyzed using t-test. * p ≤ 0.05

