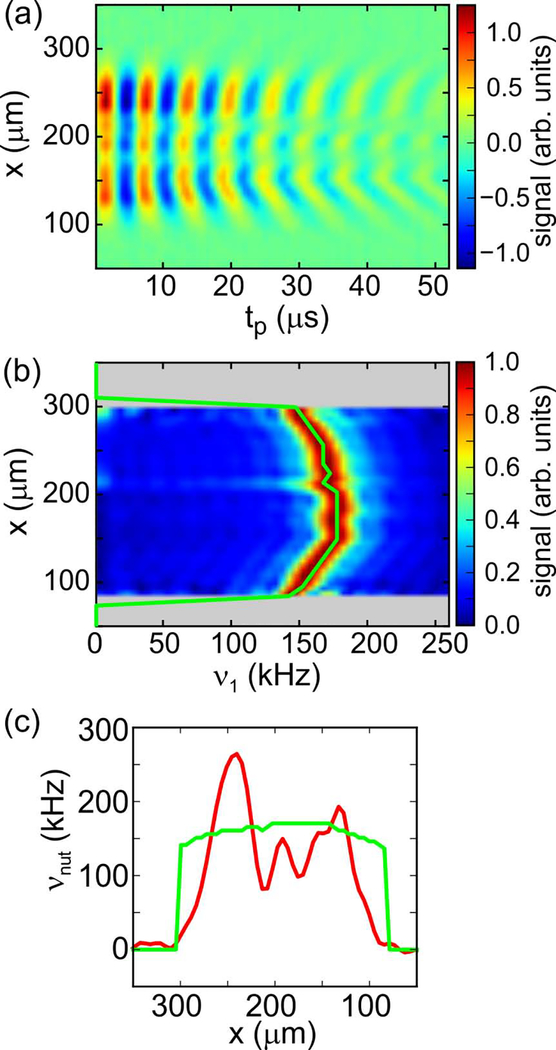
Figure 2:
(a) Data obtained with the pulse sequence in Fig. 1c, after Fourier transformation with respect to the x gradient amplitude. Oscillations as a function of tp, which is the length of the θx pulse, indicate RF nutation frequencies at each value of x. (b) Same as panel a, but after Fourier transformation with respect to tp and scaling of each horizontal signal row to the maximum signal in the row. Rows without significant signals are set to zero (grey). The green curve follows the signal maxima as a function of x. (c) Superposition of the dependence of the RF amplitude ν1 on x (green curve, derived from panel b) on a low-temperature, DNP-enhanced 1D image of the same sample (red curve).

