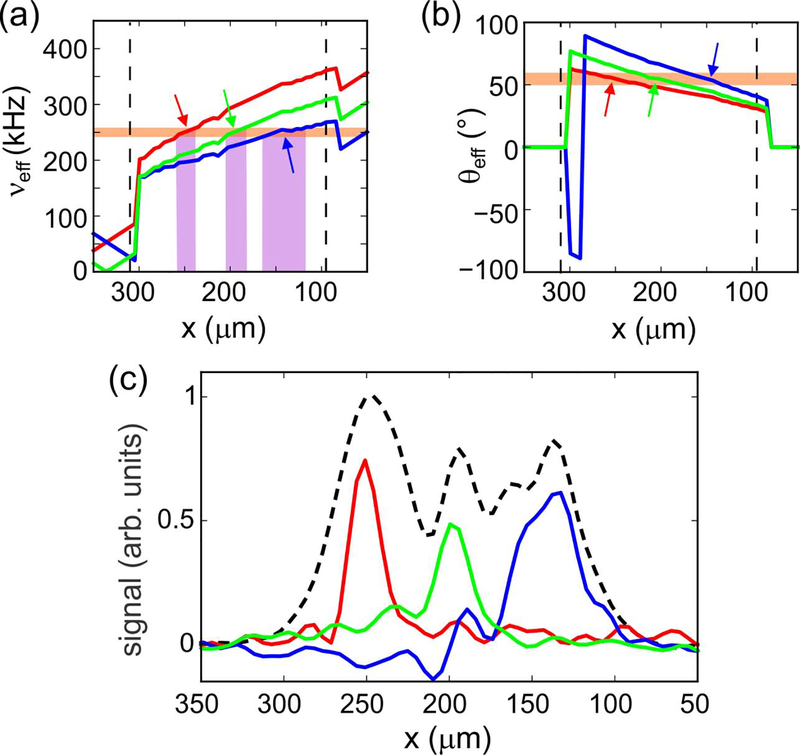
Figure 3:
(a) Effective field amplitude during the τSS period in Fig. 1b as a function of x, calculated with the RF amplitude function from Fig. 2c and assuming a linear x gradient. Red, green, and blue curves correspond to conditions that give slice selection at xS ≈ 250 μm, 200 μm, and 150 μm, respectively, with RF phase modulation at νSS = 250 kHz. The horizontal orange band indicates a range of νeff values that determines the selected slice width. Predicted slice widths for the three conditions are indicated by vertical purple bands. (b) Dependence of the effective field angle, relative to z, on x for the three conditions in panel a. The horizontal orange band indicates a ±5° range of θeff values around the magic angle, within which homonuclear dipole-dipole couplings are attenuated by factors of at least 7.9. (c) Experimental 1D slice images, color coded to correspond to the conditions in panels a and b. The dashed black line is a 1D image without slice selection. All images are plotted on the same vertical scale.

