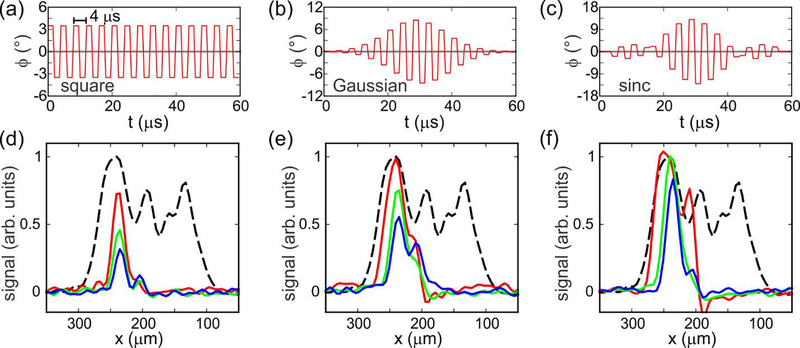
Figure 5:
Effects of shaped phase modulation on slice selection. (a-c) Plots of the RF phase (relative to y) as a function of time during the slice selection period τSS for square, truncated Gaussian, and truncated sinc shapes, respectively. In these plots, τSS = 60 μs. (d-f) Experimental 1D slice images obtained with square, truncated Gaussian, and truncated sinc shapes, respectively. Red, green, and blue curves correspond to τSS = 60 μs, 120 μs, and 180 μs, respectively. Dashed black curves are 1D images without slice selection. All images are plotted on the same vertical scale.

