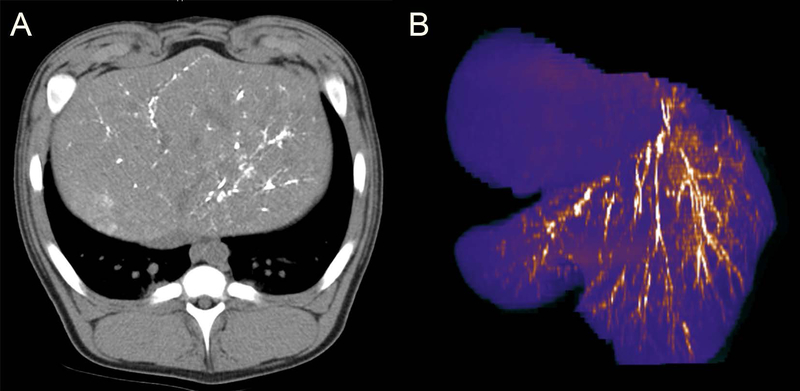
FIGURE 2.
Cross-sectional imaging by noncontrast CT at 24-hours post thermoembolization procedure. A, Axial image through the liver demonstrating persistence of radiopaque ethiodized oil from the procedure, visualized as dense white stranding areas in an otherwise darker field of surrounding liver. B, Reformatted pseudo-color image of the liver showing arborization with embolic material appearing as bright linear areas in the arterial branches. Note also the absence of the embolic material in the adjacent lobe, demonstrating controlled delivery to the target region

