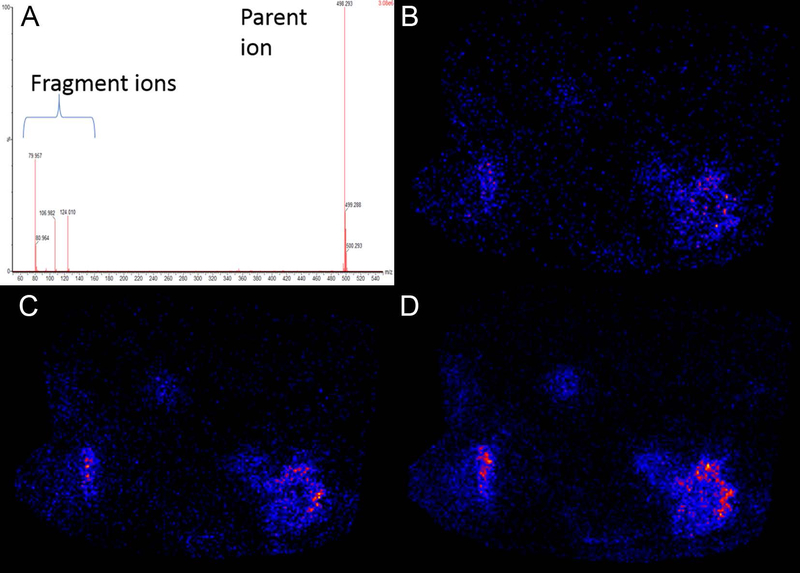
FIGURE 7.
Potential biomarker candidates for ischemia. Images of representative m/z signals noted with increased intensity at perimeter of damaged areas with assignments as follows. (A) Lysophosphatidylcholine LPC (16:0) m/z 496.324 [M + H]+, (B) diacylglycerol DG (33:4) m/z 575.484 [M + H]+, (C) ceramide Cer (t18:0/16:0) m/z 578.503 [M + Na]+, (D) phosphatidylethanolamine PE (33:3) m/z 738.432 [M + K]+, (E) larger view of A with yellow arrows highlighting the perimeter pattern. (F) H&E section

