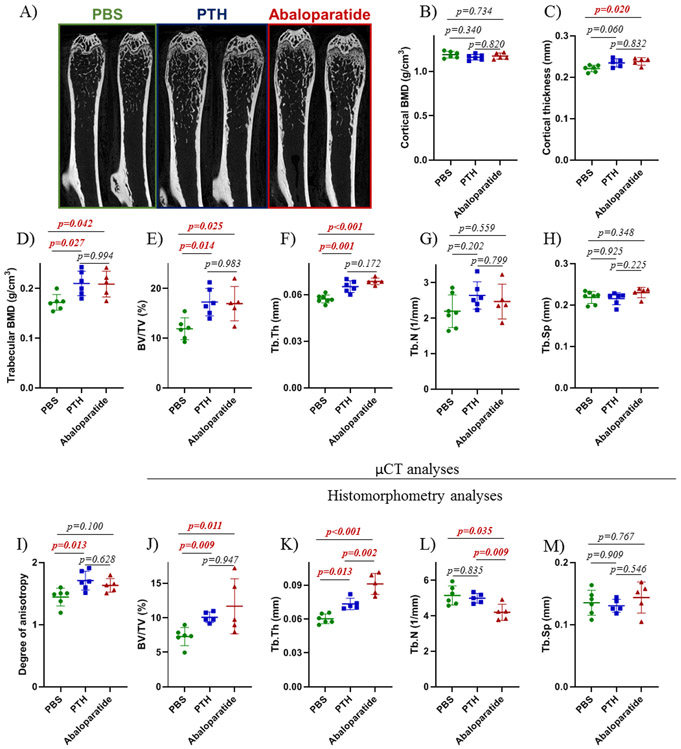
Figure 2: PTH (1-34) and abaloparatide similarly improved trabecular bone volume and cortical thickness in mice.
A) Representative images of right femur showing the changes in trabecular bone in male mice treated with PTH (1-34) or abaloparatide at 4 months of age for 6 weeks. Femurs were prepared for high resolution μCT and images were reconstructed with NRecon software. B - C) A 600 μm cortical volume corresponding to 62 slices of the mid-diaphysis was examined for B) cortical bone mineral density and C) cortical thickness. D - I) A 970 μm volume corresponding to 100 slices of the mid-metaphysis was examined for trabecular bone microarchitecture. D) trabecular bone mineral density (BMD), E) trabecular bone volume (BV/TV), F) trabecular thickness (Tb.Th), G) trabecular number (Tb.N), H) trabecular separation (Tb.Sp) and I) degree of anisotropy. J – M) Femoral thin sections (5 μm) were stained with Masson’s trichrome. Measurements were conducted in the secondary spongiosae for histomorphometric analysis of J) trabecular bone volume (BV/TV), K) thickness of trabeculae (Tb.Th), L) number of trabeculae (Tb.N) and M) space between trabeculae (Tb.Sp). 5-7 mice per group, results are means ± SD. All data were analyzed for normality and equivalence of variance before a 1 way ANOVA followed by a Tukey’s multiple comparison test. The histomorphometric analysis of bone volume did not show equivalence of variance so we used Kruskal-Wallis, a non-parametric test. All exact p values are shown.

