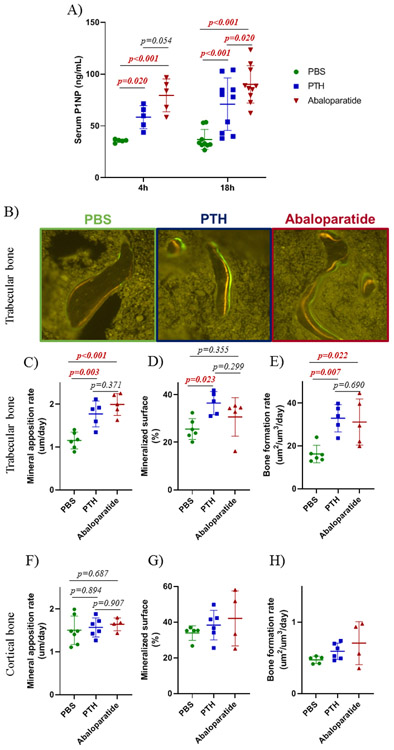
Figure 3: PTH (1-34) and abaloparatide similarly improved bone formation in mice.
At the end of the treatments, sera were collected at 4 or 18 h after the last injection. A) To analyze bone formation, serum P1NP levels were measured by ELISA in male mice treated with PTH (1-34) or abaloparatide. B - D) Mice were injected with tetracycline at day 7 and with calcein at day 2 before death to determine bone formation. Femoral thin sections (10 μm) were obtained. B) Representative images of right femurs showing differences in double labeling in trabecular bone in mice treated with PTH (1-34) or abaloparatide. Measurements were performed in the secondary spongiosae for trabecular dynamic analyses: C) mineral apposition rate, D) mineralized surface and E) bone formation rate. Measurements were performed in the mid-diaphysis for cortical dynamic analyses: F) cortical mineral apposition rate, G) cortical mineralized surface and H) cortical bone formation rate. 5-7 mice per group, results are means ± SD. Histomorphometric data were analyzed for normality and equivalence of variance before a 1 way ANOVA followed by a Tukey’s multiple comparison test. The bone formation rate (cortical and trabecular bone) and the cortical mineralized surface did not show equivalence of variance so we used Kruskal-Wallis, a non-parametric test. For the serum P1NP, normal distribution was not demonstrated so a rank transformation was done before performing new normality and equivalence of variance tests and 2 way ANOVA followed by Bonferroni’s multiple comparison test. Most exact p values are shown.

