
Figure 1.
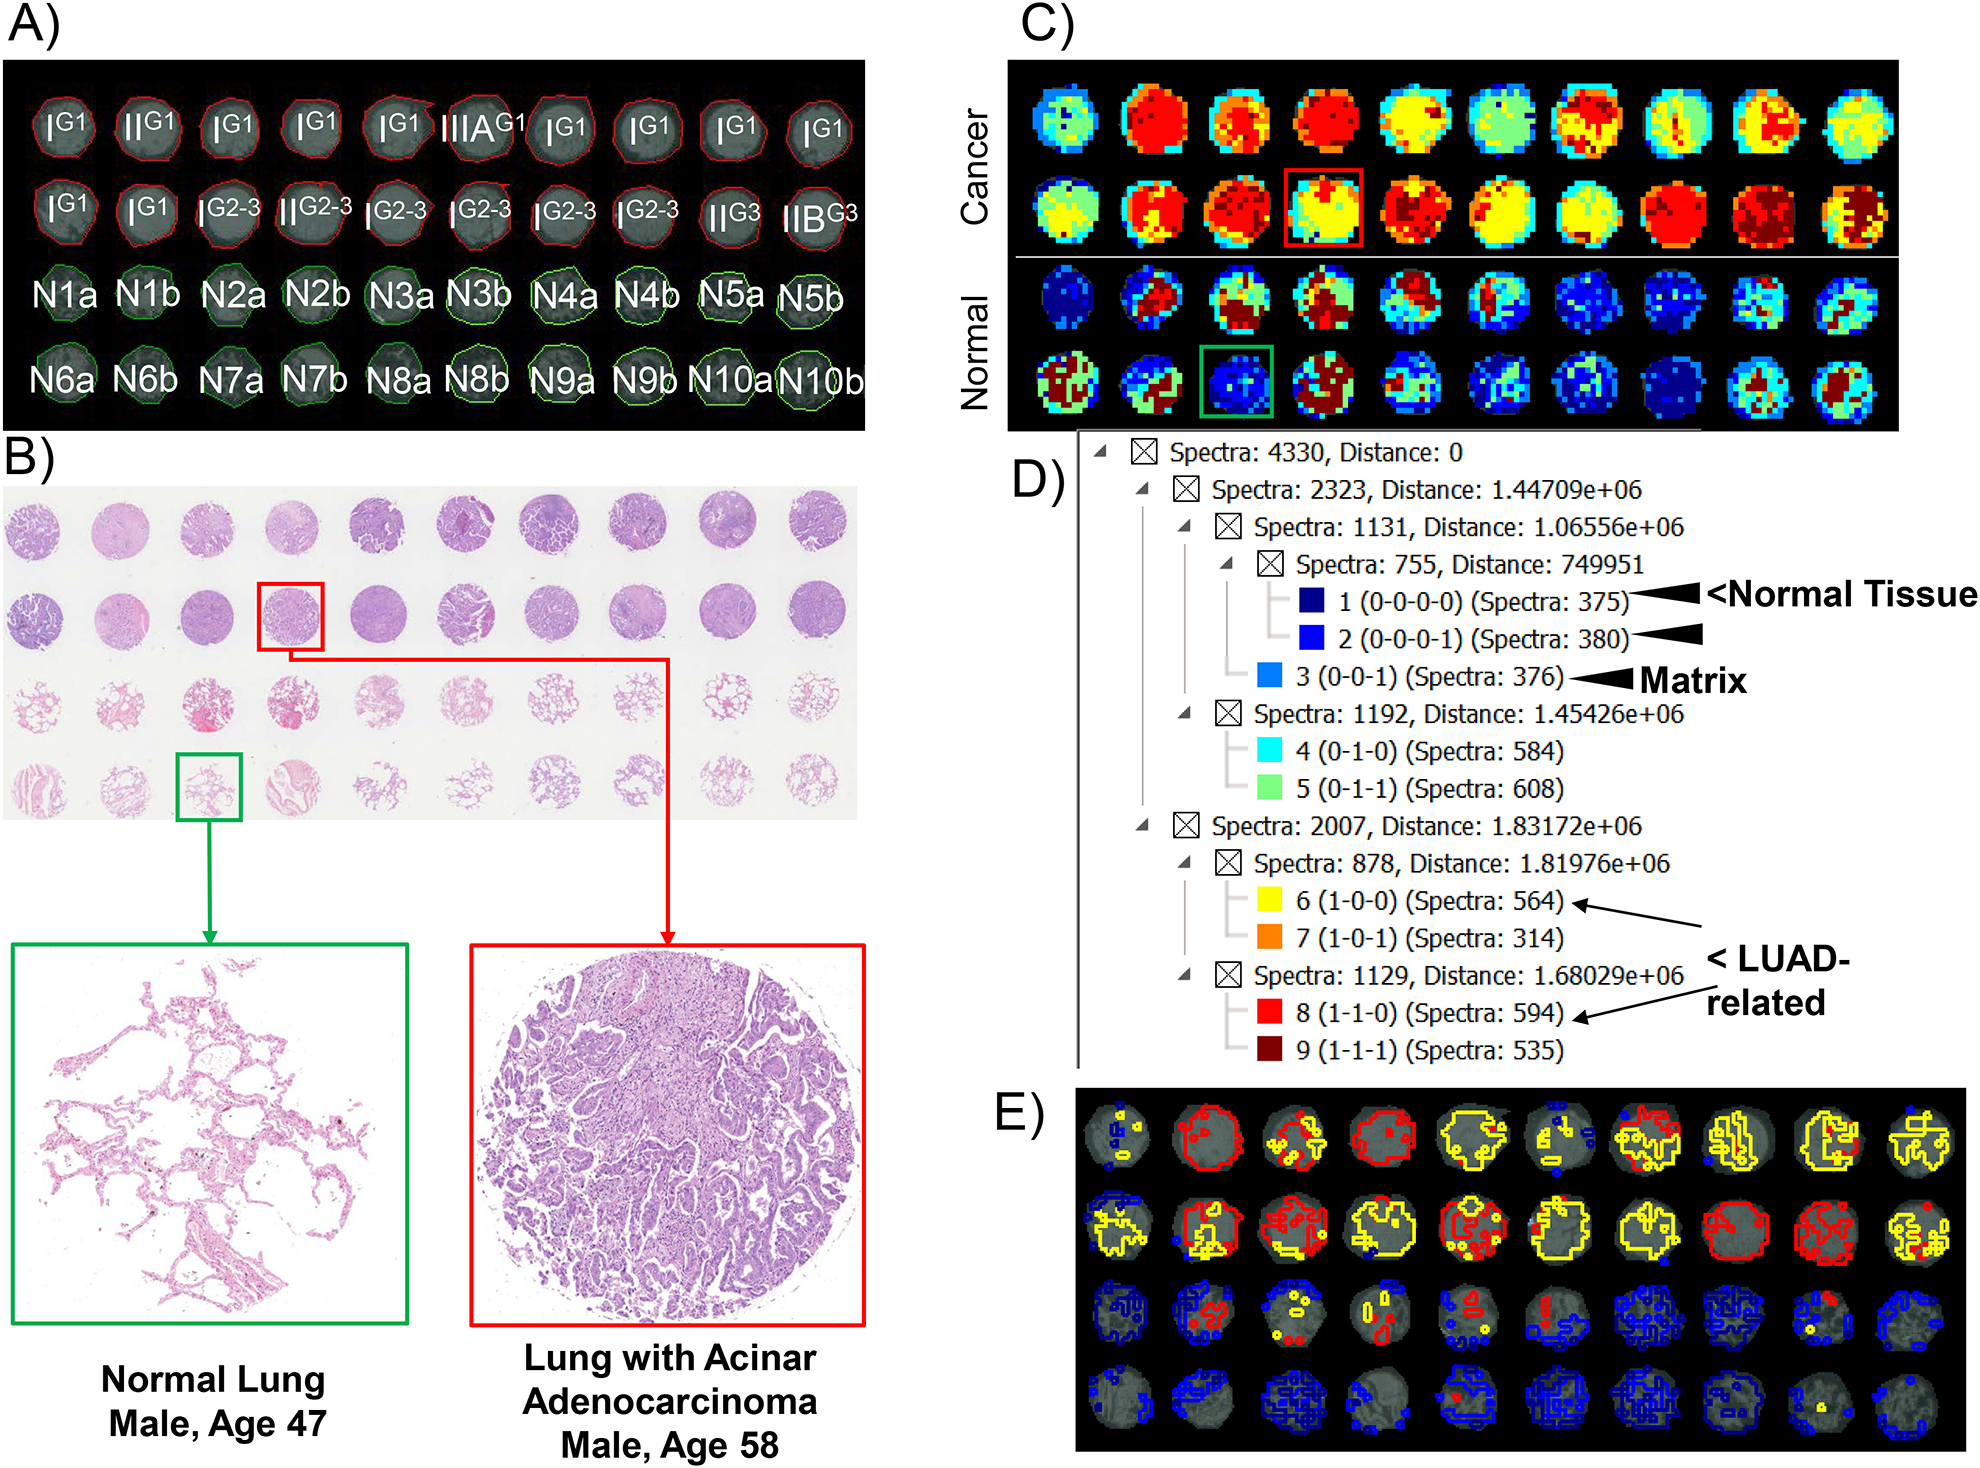
Tissue microarray containing lung adenocarcinoma (LUAD; n=20, one core from each patient tissue) and normal lung tissue (n=10, two different cores from each normal lung). A. 2015 WHO classification of lung cancer. Stage and grading of the TMA stage is indicated in capital I, II, IIB or IIIA. Grade is superscripted. Normal cores are marked N for normal, number is the normal lung core number, a or b reports different locations. B) hematoxylin and eosin staining. Red highlights lung adenocarcinoma core while green highlights a normal core, shown below in higher magnification. Cores are 1 mm in diameter. C) Image segmentation done on 2,190 peaks highlighting overall differences in spectral composition between normal and adenocarcinoma. D) Hierarchical tree from image segmentation reporting clusters per tissue type. E) Extracted regions enriched in normal or LUAD.