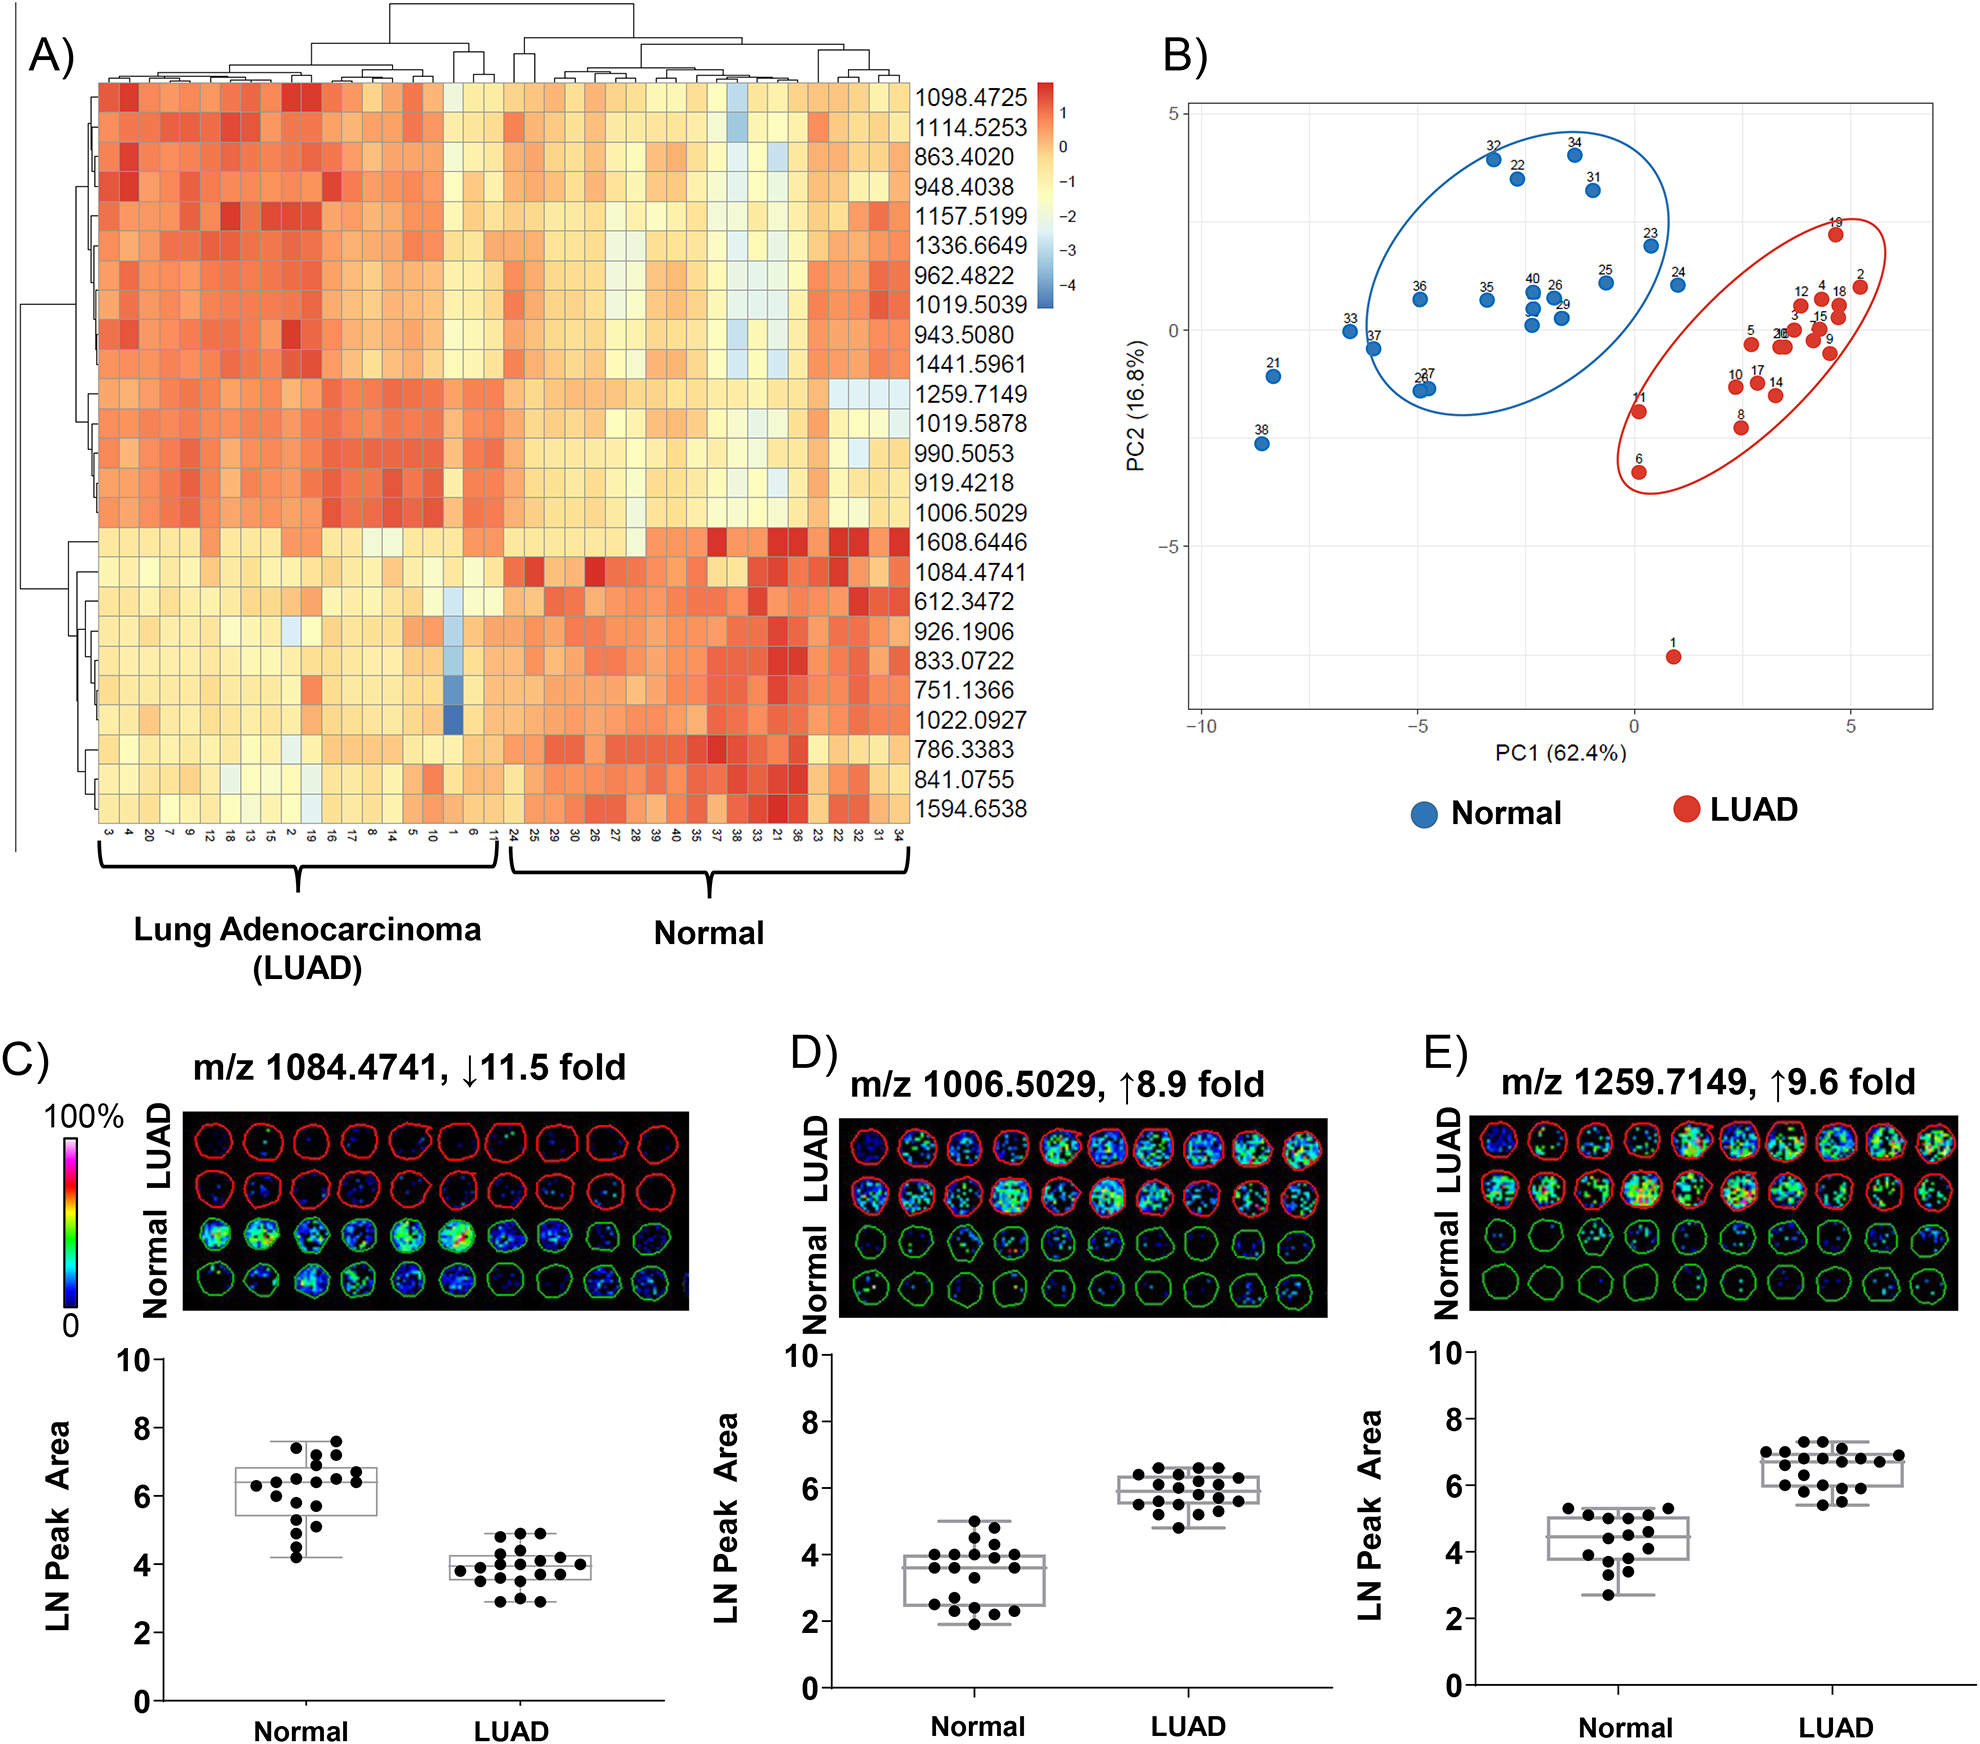
Figure 2.

ECM IMS differentiates low-grade lung adenocarcinoma from normal lung tissue. A) Peptides differentiated by area under the receiver operating curve >0.7. B) Principal component analysis demonstrates separation based on origin of spectral data from normal or adenocarcinoma cores. Component 1, differences between samples types, explains 62% of the variance. C-D) Example peptides shown as images and quantitative data points per core. Peptide changes are greater than 8 fold.
