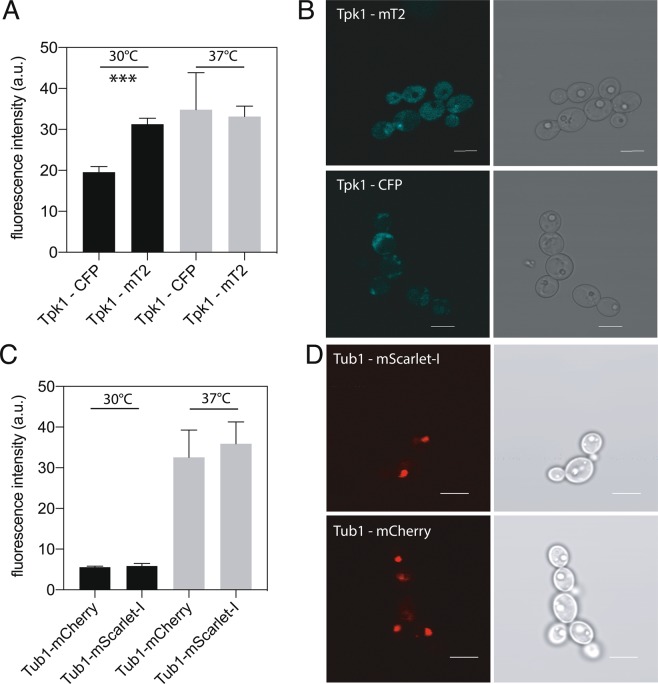
Figure 3.
Fluorescence intensity measurements using a BD influx flow cytometer on C. albicans strains endogenously expressing (A) CFP or mTurquoise2 attached to Tpk1 and (C) mCherry or mScarlet-I attached to Tub1. Cells were grown overnight on low fluorescent medium and brought to an optical density at 600 nm (OD600) of 0.2 in fresh Low Fluorescent medium. Strains were allowed to grow to the exponential phase (4–5 hrs) at 30 °C or 37 °C, before measurement. Data shown is corrected for wild type autofluorescence. Asterisks denote significance level with ***corresponding to p < 0,001. B and D are confocal images taken with a Fluoview 1000 confocal microscope, using the appropriate excitation and emission filters for each fluorescent protein. Shown are representative images of Tpk1 – CFP and Tpk1 – mTurquoise2 (mT2) in panel B and representative images of Tub1 – mCherry and Tub1 – mScarlet-I in panel D.

