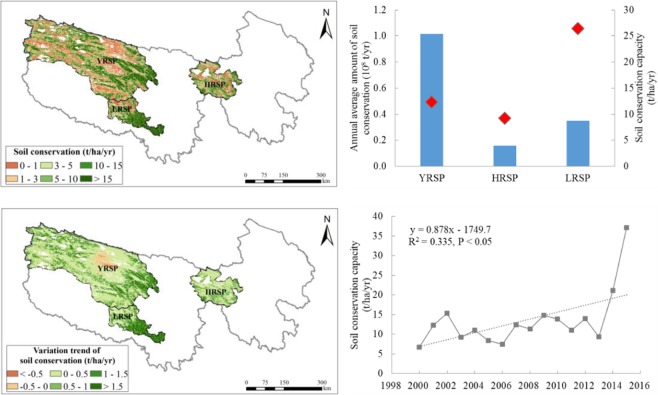
Figure 5.
Spatial distribution of soil conservation service in the SNP (left upper) and its changes from 2000 to 2015 (left bottom), annual average amount of soil conservation and its capacity in the different sub-parks (the bars means soil conservation amount and the diamonds means soil conservation capacity) (right upper) and interannual variation of soil conservation capacity (right bottom). Map created in ArcMap 10.4 (Environmental Systems Resource Institute, ArcMap 10.4 ESRI, Redlands, California, USA).

