Figure 1.
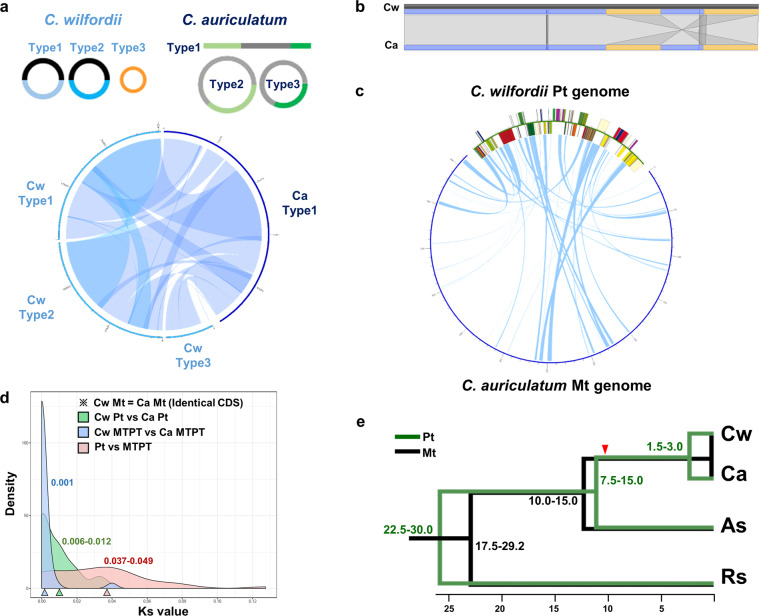
Plastid–mitochondrial genome structure, flux and evolution in Cynanchum species. (a) Schematic representation of each type of mitochondrial genome and comparison in C. wilfordii (Cw) and C. auriculatum (Ca). Each line represents a type of mitochondrial genome (of the three per species), and genomic blocks with homology are connected at both the intra- and interspecies levels. The Circos plot shows synteny between the mitochondrial genomes of Cw and Ca. (b) Comparison of the overall plastid genome structures of Cw and Ca. Yellow rectangles indicate inverted repeat blocks, and small lines indicate repeats between these blocks. (c) Circos plot comparing the plastid and mitochondrial genomes of the two Cynanchum species. (d) Density plot of the rates of nucleotide substitution between homologous genes (Ks values) in the plastid and mitochondrial genomes of the two Cynanchum species. The green line shows Ks values between the plastid genes of Cw and Ca, and the gray line shows those between the MTPTs of the two species, whereas the red line shows Ks values between the MTPT and its plastid counterpart for each species. The mode value of Ks is marked with a triangle in each case (Supplementary Table 3). (e) Estimation of divergence time among four Apocynaceae species based on Ks values of plastid (green) and mitochondrial genes (black). The red triangle indicates the estimated time of MTPT insertion in the common ancestor of the two Cynanchum species. The synonymous substitution rates per year per base are 2 × 10⁻⁹ for plastid and 0.6 × 10⁻⁹ for mitochondria. As, Asclepias syriaca; Rs, Rhazya stricta.

