Figure 1.
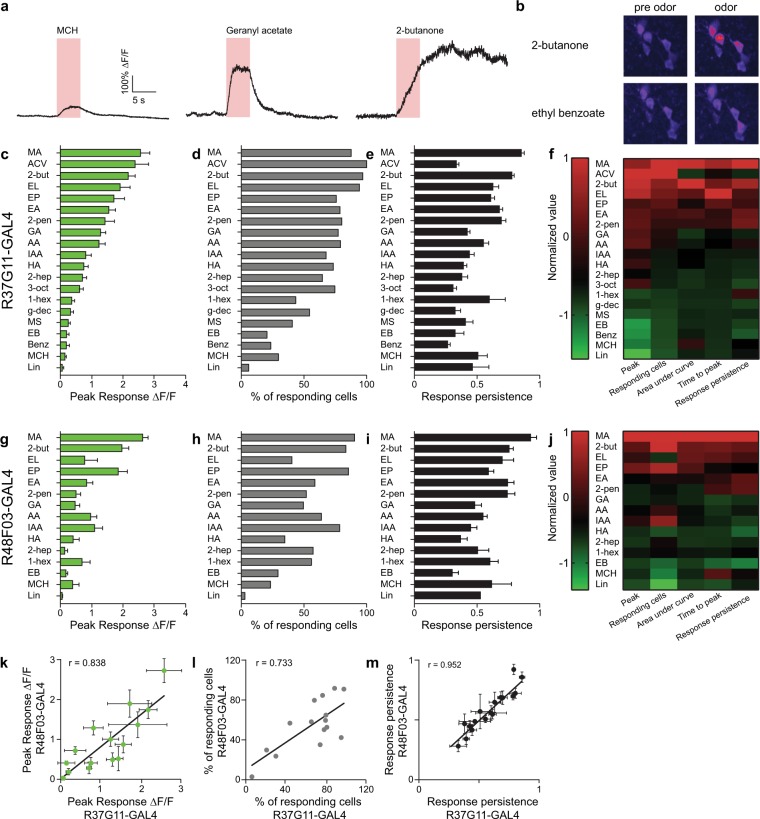
PD2a1/b1 neurons display variable odor responses to high odor concentrations. (a) Representative single odor response traces obtained from the same neuron. Different odor response dynamics and amplitudes were observed. Odor pulse is highlighted in red. (b) Representative activity maps demonstrating variable population odor responses in the same fly to 2-butanone and ethyl benzoate. Pre-odor pulse and during odor pulse activity maps are depicted. (c,g) Peak ∆F/F responses during odor response for GCaMP6f-labelled cells driven by drivers R37G11-GAL4 (c) and R48F03-GAL4 (g), respectively. (55 ≥ n ≥ 20 and 46 ≥ n ≥ 14 cells, respectively. At least 5 different flies were imaged from each genotype.) (d,h) Percentage of responding neurons obtained from all neurons from all flies pooled for cells labeled by R37G11-GAL4 (d) and R48F03-GAL4 (h). (55 ≥ n ≥ 20 and 46 ≥ n ≥ 14 cells, respectively. At least 5 different flies were imaged from each genotype.) (e,i) Response persistence for R37G11-GAL4 (e) and R48F03-GAL4 (i). Response persistence was measured as the inverse of the ratio between the maximal peak of the odor response and the average response 5 seconds after the maximal peak time. (55 ≥ n ≥ 20 and 46 ≥ n ≥ 14 cells, respectively. At least 5 different flies from each genotype were imaged.) (f,j) Heatmaps of normalized selected parameters: peak response, number of responding cells, area under the curve, time to peak, and response persistence for R37G11-GAL4 and R48F03-GAL4, respectively. To compare different odors across several parameters, we normalized the results by calculating a Z-score for each odor value. The calculated Z-scores were further divided by the maximal Z-score for each parameter to yield a maximum value of 1. In general, a high correlation was observed between the different parameters. (k–m) Correlation between the parameters obtained for R37G11-GAL4 and R48F03-GAL4 for peak ∆F/F (k), the percentage of responding neurons (l) and the response persistence (m). (See Supplementary Table S1 for statistical analysis).

