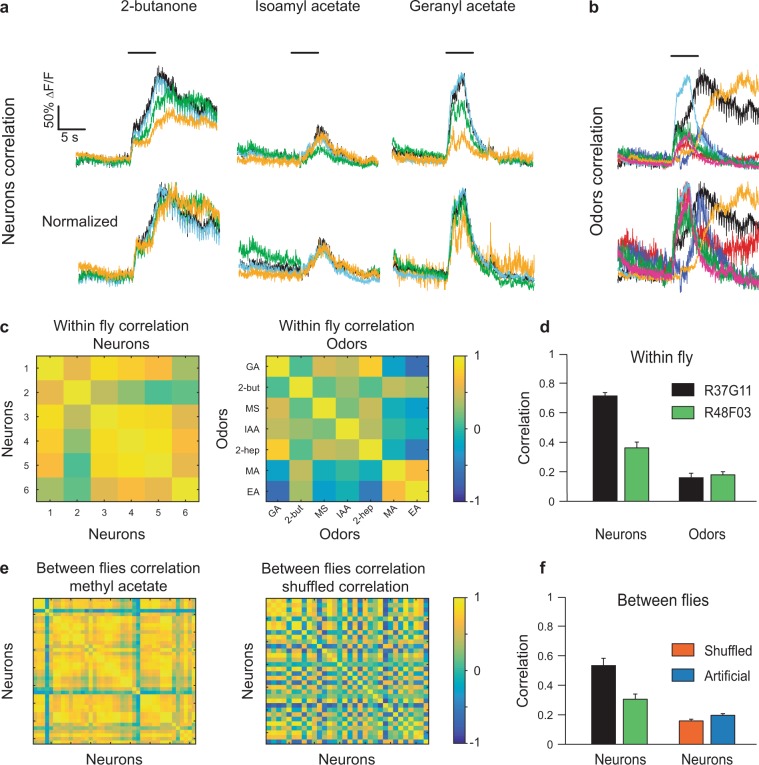
Figure 2.
PD2a1/b1 neurons exhibit correlated population activity. (a) Odor responses from four PD2a1/b1 cell bodies in the same fly to three odors as indicated. A high correlation between the temporal pattern of the responses was observed. (b) Odor responses from one PD2a1/b1 neuron to seven odors. The temporal dynamics of the responses are not correlated. (c) Left, an example of the correlation values of six PD2a1/b1 neurons in the same fly obtained for the seven odors on the right. Right, an example of the correlation values of seven odors obtained for the six neurons on the left. (d) Within-fly mean correlation values for both driver lines (R37G11-GAL4 and R48F03-GAL4) for neurons and odors. High correlation values were obtained for the neurons and low correlation values for the odors (n = 26 flies and n = 9 flies, respectively). (e) Left, an example of the correlation values for a single odor obtained for all PD2a1/b1 neurons from all flies. Right, an example of the correlation values when the neuronal responses were shuffled (see Methods). (f) Left, between-flies mean correlation values for both driver lines (R37G11-GAL4, and R48F03-GAL4, n = 26 flies; the number of neurons ranged from 20 to 55 and n = 9 flies; the number of neurons ranged from 14 to 46, respectively). Right, Between-flies correlation for shuffled neurons and for artificial neurons (see Methods).

