Figure 3.

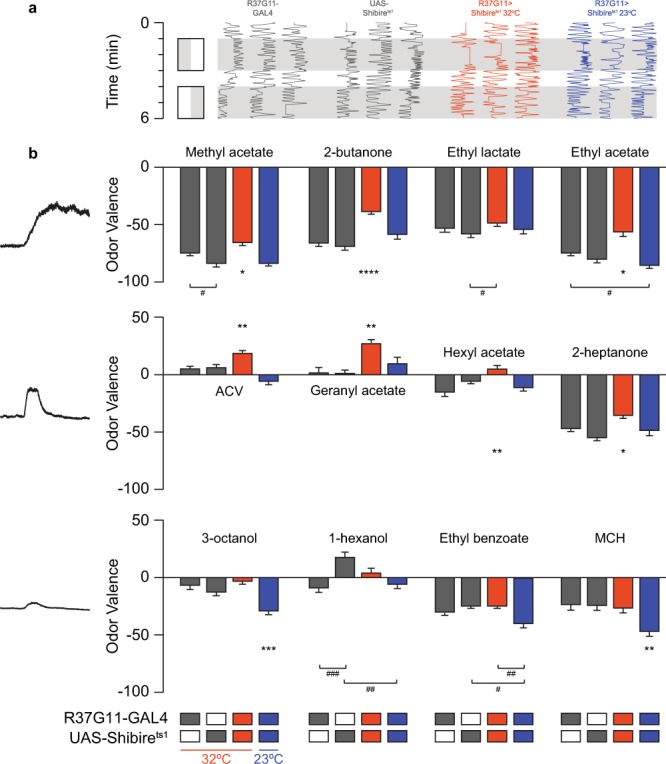
PD2a1/b1 neurons contribute to aversive responses to high odor concentrations. (a) An example of traces obtained for naïve flies for 2-butanone. Gray, parental control groups; red, the experimental group at 32 °C; blue, the experimental control group at 23 °C. Naïve response to an odor (gray) was tested against mineral oil (white). (b) Mean valence scores (see Methods) from experiments as in a, for the designated odors. Odors are arranged according to their response profile as in Fig. 2 and Supplementary Fig. S2. A consistent shift towards more positive valence values was observed during PD2a1/b1 inhibition for all odors that activate PD2a1/b1 neurons, except for ethyl lactate. No effect during PD2a1/b1 inhibition was observed for odors that only weakly activate PD2a1/b1 neurons. (137 ≥ n ≥ 21 flies for all conditions, * indicates a significant difference of the indicated group from all other groups according to a multiple comparison test. The lowest value of all multiple comparison tests is presented. # indicates a significant difference only between the two indicated groups. *, #p < 0.05, **, ##p < 0.01, ###p < 0.0005, ****p < 0.0001, see Supplementary Table S1 for statistical analysis).
