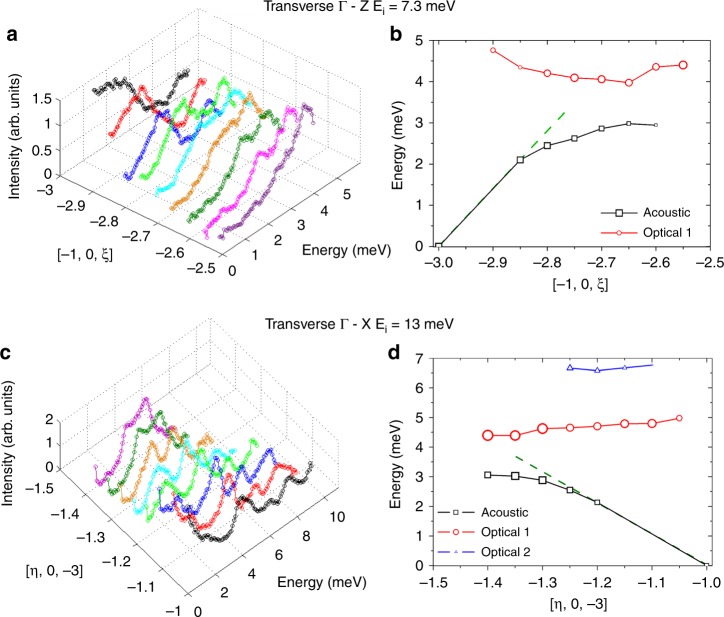
Fig. 5. Phonon anti-crossings.
Panels a and c report 1D cuts as a function of energy of the LET data, obtained integrating around different values of Q for a –Z around [−1, 0, −3] with = 7.3 meV (Fig. 3b) and c –X around [−1, 0, −3] with = 13 meV (Fig. 4c). Panels b and d report the position of the peaks obtained from the 1D cuts of the data for both acoustic (black scatters) and optical modes (red and blue scatters). The intensity of each peak is translated into scatter dimension and the dashed green lines interpolate the linear behaviour of the acoustic modes. The data show the typical features of phonon ACs: bending of the acoustic mode, intensity exchange between acoustic and optical branches, with the latter drifting apart after the AC.

