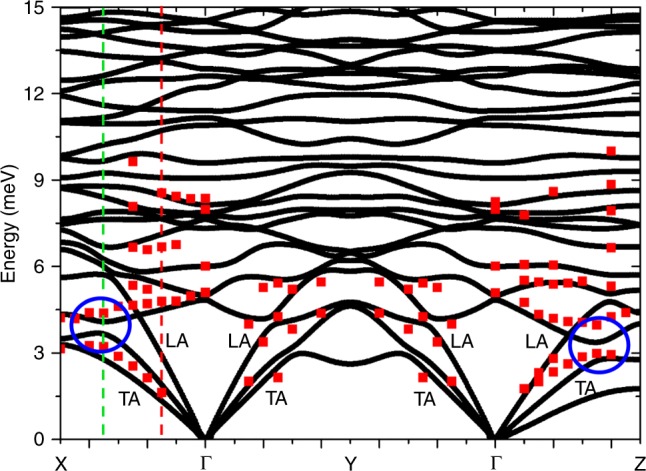
Fig. 6. DFT calculations of phonon dispersions compared to experimental excitation energies.

DFT calculations of the low-energy phonon dispersion curves of [VO(acac)] up to 15 meV along the path X(0.5, 0, 0)–(0, 0, 0)–Y(0, 0.5, 0)–(0, 0, 0)–Z(0, 0, 0.5) (black lines), where the coordinates are expressed in the reciprocal lattice basis units. Red scatters are the energies of experimental excitations extracted by fitting 1D cuts of the data as in Fig. 2 (error bars as SD are of the order of scatters dimension). Not all the modes are visible in the considered configurations. Blue circles highlight ACs between acoustic and low-lying optical branches along –X and –Z. Red and green dashed lines indicate the q vectors at which we have investigated the atomic displacements far from and at the ACs, respectively.
