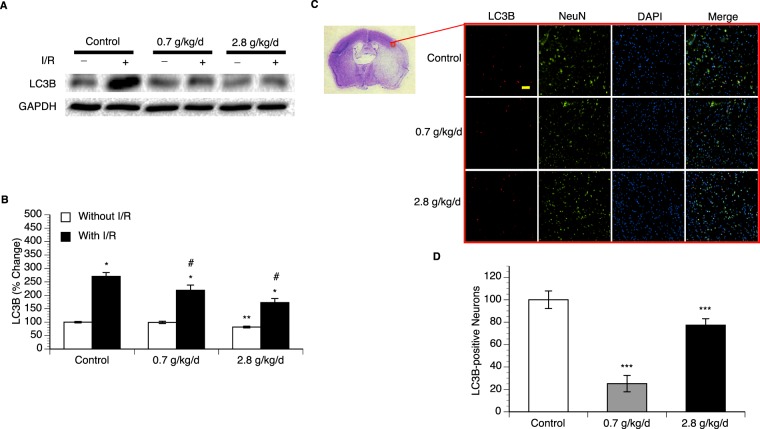
Figure 5.
Effect of chronic ethanol consumption on LC3B expression in the cerebral cortex. (A) Representative Western blots. (B) Values of LC3B expression are means ± SE for 6 mice in each group. *P < 0.05 vs Without I/R. **P < 0.05 vs Control without I/R. #P < 0.05 vs Control with I/R. Analyzed using two-way ANOVA with Tukey’s post-hoc. Analyzed using two-way ANOVA with Tukey’s post-hoc. (C) Representative double staining (10×, scale bar 100 μm) of NeuN and LC3B in peri-infarct cortex of the parietal cortex at the coronal section 0.23 mm caudal to bregma. (B) Values of LC3B-positive neuron are means ± SE for 6 mice in each group. ***P < 0.05 vs Control. Analyzed using one-way ANOVA with Dunnett’s post-hoc.

