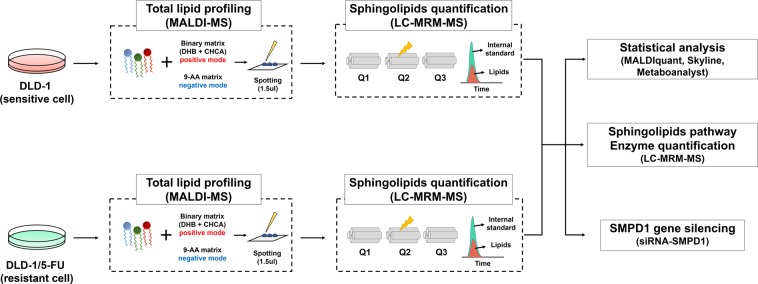
Figure 1.
Schematic diagram of global lipidomic analysis. Total lipids were extracted from 5-FU–sensitive (DLD-1) and –resistant (DLD-1/5-FU) colorectal cancer cells and subjected to MALDI-MS analysis in positive and negative modes in triplicate. MALDI-MS spectra were processed by MALDI-Quant in R package. The transition of sphingolipid and related enzymes (Q1 and Q3) was optimized and quantified using MRM-based LC-QqQ-MS analysis in triplicate. Statistical analysis of quantified lipids was carried out using Metaboanalyst.

