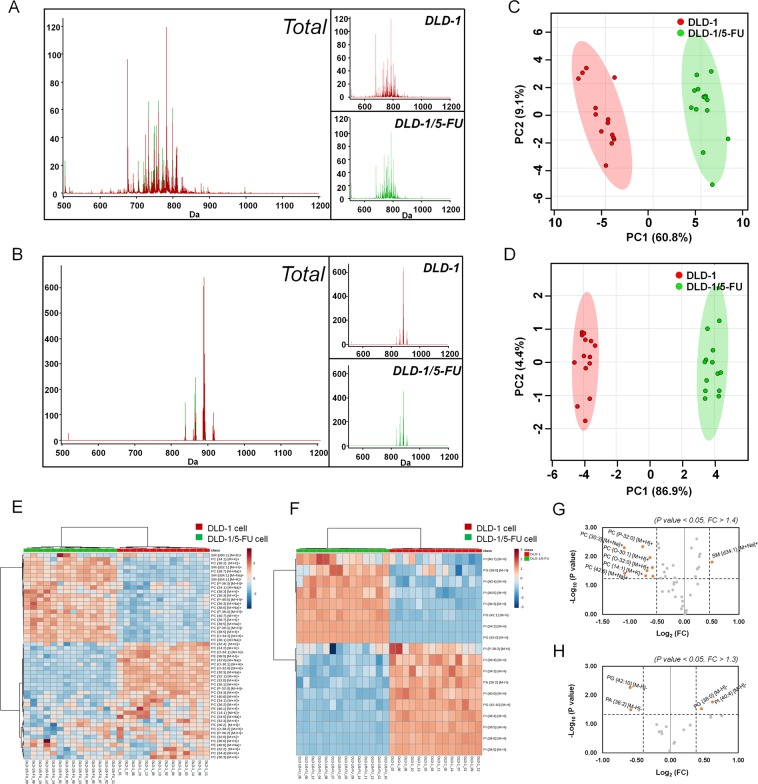
Figure 2.
MALDI-TOF-MS lipidomic analysis of DLD-1 and DLD-1/5-FU cells. (A) Average chromatogram of DLD-1 (in red) and DLD-1/5-FU (in green) obtained with positive ion mode and (B) negative mode. (C) Principal component analysis (PCA) of the acquired MS spectra from DLD-1 (shown in red) and DLD-1/5-FU (shown in green) in positive and (D) negative modes. Hierarchical clustering of each sample data set showing differentially expressed lipids in (E) positive mode and (F) negative mode. Volcano plots display differentially expressed lipids in (G) positive and (H) negative mode, respectively (fold change > 1.4, p value < 0.05 in positive and fold change > 1.3, p value < 0.05 in negative mode).

