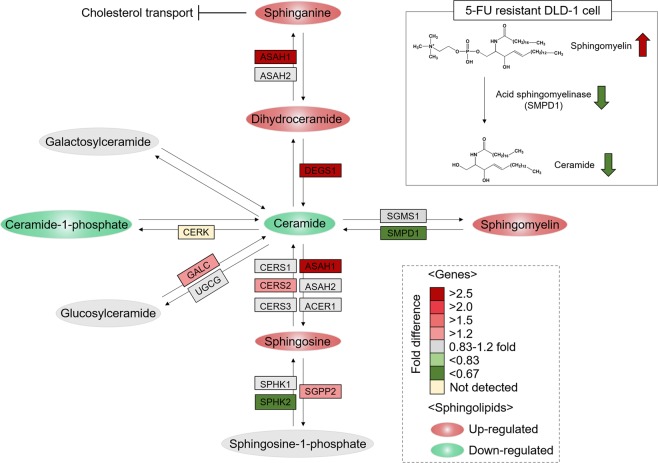
Figure 3.
Quantitative results of sphingolipids and enzymes by LC-MRM-MS. Illustration of differences in the expression of sphingolipids and proteins in the sphingolipid metabolism pathway using MRM-based quantification. The abbreviations of proteins are shown in boxes with different colors to represent fold change in DLD-1/5-FU compared to DLD-1. Upregulated sphingolipids are shown in red circles, while downregulation is shown in green circles.

