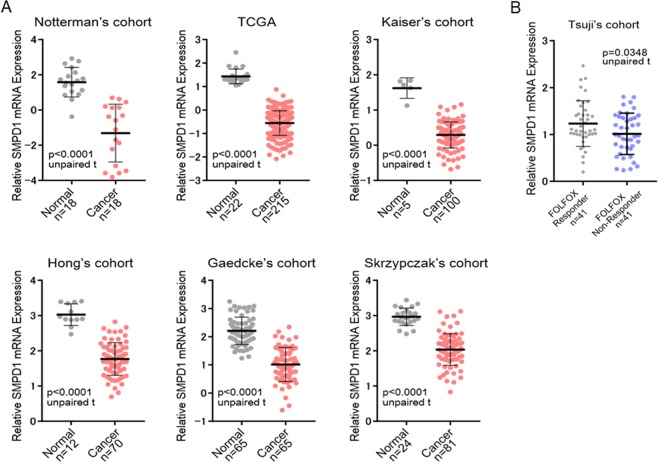
Figure 5.
(A) The mRNA expression level of SMPD1 was investigated for several CRC cohorts. The n number of independent patient samples is indicated in each panel. An unpaired t-test was performed to examine the difference between the expression levels of SMPD1 mRNA in normal and CRC tissues. Error bars indicate standard deviations. (B) FOLFOX is 5-FU+ l-LV+L-OHP and is a standard chemotherapy regimen for CRC. SMPD1 mRNA expression level in FOLFOX responder and non-responder group from Tsuji’s cohort.

