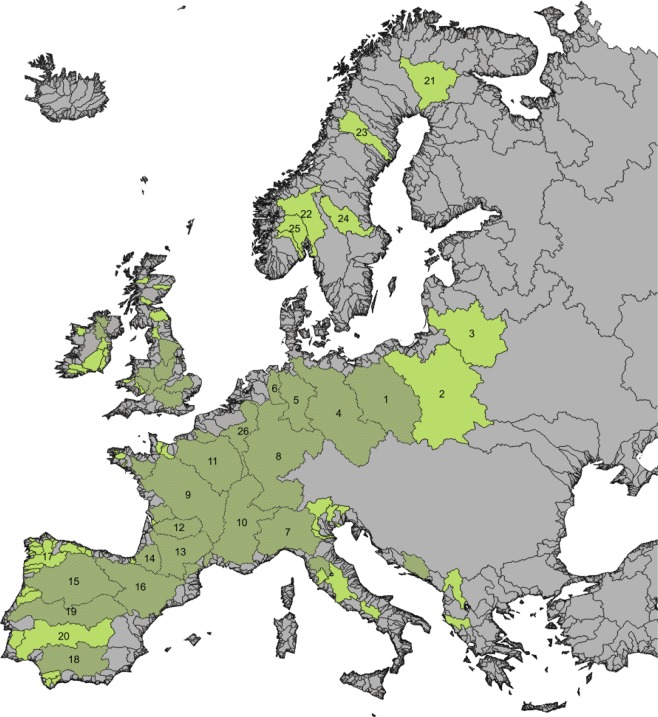
Figure 5.
Current distributional range of the sea lamprey in European watersheds. Watersheds where the migrating sea lamprey is reported are displayed in green and watersheds (with an area > 1000 km2) where the lamprey co-occurs with the European catfish are displayed in dark green4. Sea lamprey distribution map in European watersheds was established from one compilation of the available literature (including scientific reports, books, online data and grey literature). More recent publications are detailed hereafter by watershed: (1), Oder32; (2), Wisla32; (3), Nemunas32; (4), Elbe33; (5), Weser34; (6), Ems34; (7), Pô35; (8), Rhine33; (9), Loire (http://www.logrami.fr/actions/stations-comptage/); (10), Rhône36; (11), Seine32; (12), Dordogne (http://www.migado.fr/category/publications/); (13), Garonne (http://www.migado.fr/category/publications/); (14), Adour33; (15), Douro19; (16), Ebre19; (17), Minho19; (18), Guadalquivir19; (19), Tajo19; (20), Guadiana19; (21), Kemijoki36; (22), Glomma36; (23), Umeälven36; (24), Dalälven32; (25), Skien32; (26), Meuse36. This distribution was updated for other watersheds with information from17,37,38, and the following web sites: http://jncc.defra.gov.uk/ProtectedSites/SACselection/species.asp?FeatureIntCode=S1095; http://www.observatoire-poissons-migrateurs-bretagne.fr/lamproies; http://normandiegrandsmigrateurs.fr/les-poissons-migrateurs-de-normandie/lamproies/comptage-geniteurs-de-lamproies/. The map was generated using QGIS 2.14.0-Essen (https://www.qgis.org/en/site/).

