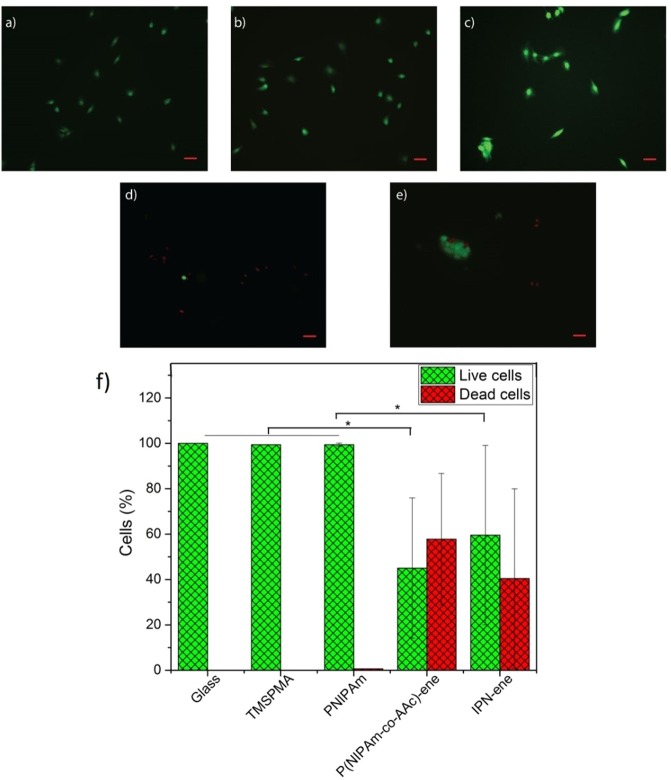
Figure 13.
Live/dead assay images for cell viability of cells grown on pristine glass, glass/TMSPMA, PNIPAm, P(NIPAm-co-AAc)-ene and IPN-ene (named IPN). In (a–e) we show fluorescent live/dead assay images representing cell viability. In (f) a statistical analysis of a number of cells dead and the number of cells alive is reported. All data represent the mean values ± standard error, *p < 0.5. Red is for dead cells and green for living cells. The initial seeding density was 20000 cells/cm2 and the incubation time 24 h. Red scale bar: 50 µm.

