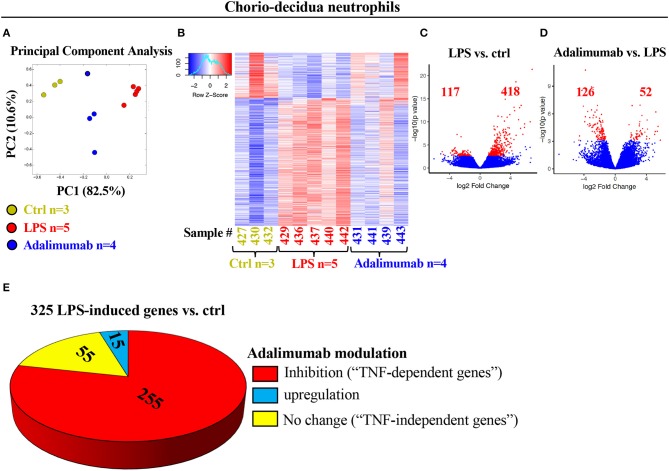
Figure 2.
Profound changes in the global transcriptional landscape of chorio-decidua neutrophils upon different treatments. (A) Principal-component analysis of RNA-seq data from FACS-sorted chorio-decidua neutrophils of control (Ctrl) (green dots; n = 3), LPS (red dots; n = 5), and Adalimumab animals (blue dots; n = 4) showing distinct clustering based on exposures. (B) Heatmap of genes that are differentially expressed (DEGs) between chorio-decidua neutrophils upon different treatments showing minimal inter-animal variability within each group (Ctrl n = 3; LPS n = 5; Adalimumab n = 4). (C,D) Volcano plots displaying differentially expressed genes. Red dots and numbers indicate genes with an FDR-adjusted value <0.05. (E) Pie chart shows 325 genes that are induced by LPS (≥4-fold change vs. ctrl). Of those 325 genes, 225 genes are downregulated by Adalimumab (↓ ≥1.5-fold change vs. LPS, “TNF-dependent genes”), 55 do not change their expression upon Adalimumab treatment (↓1.5 < x < ↑1.5-fold change vs. LPS, “TNF-independent genes”), and 15 genes are upregulated by Adalimumab (≥↑1.5-fold change vs. LPS).

