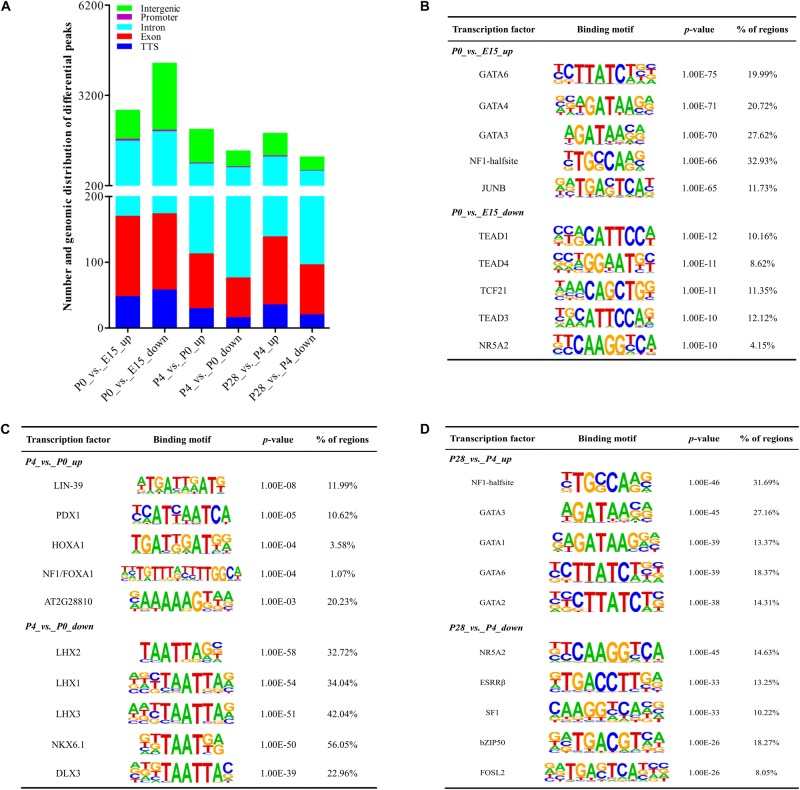
FIGURE 5.
Dynamic changes of accessible chromatin and motif analysis of differential peaks during early ovarian development. (A) Number and genomic distribution of significantly increased and decreased peaks between different stages of early ovarian development. (B–D) Top 5 transcription factor binding motifs enriched in significantly increased and decreased peak regions according to the p-values between P0 vs. E15, P4 vs. P0, and P28 vs. P4, respectively.

