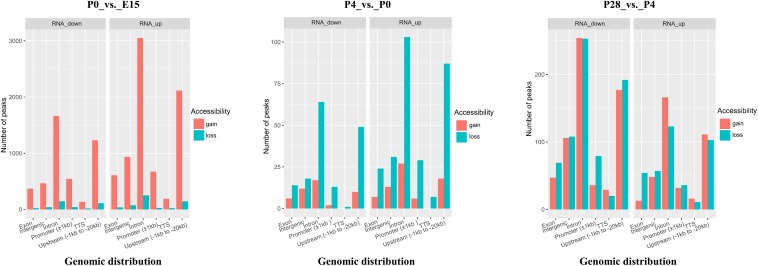
FIGURE 6.
Bar plots indicating the number and genomic distribution of developmental stage-unique peaks around TSSs (±100 kb) of significantly up- and downregulated genes between P0 vs. E15, P4 vs. P0, and P28 vs. P4, respectively. Genomic annotations included the promoter (± 1 kb of TSS), upstream (between –1 and –20 kb of TSS), TTS (between –100 and + 1 kb of TTS), exon, intron, and intergenic region, and the front region was regarded as the final annotation according to the above order if overlap occurred. Gain or loss of accessibility indicates the newly appeared or disappeared open chromatin regions between each pairwise comparison.

