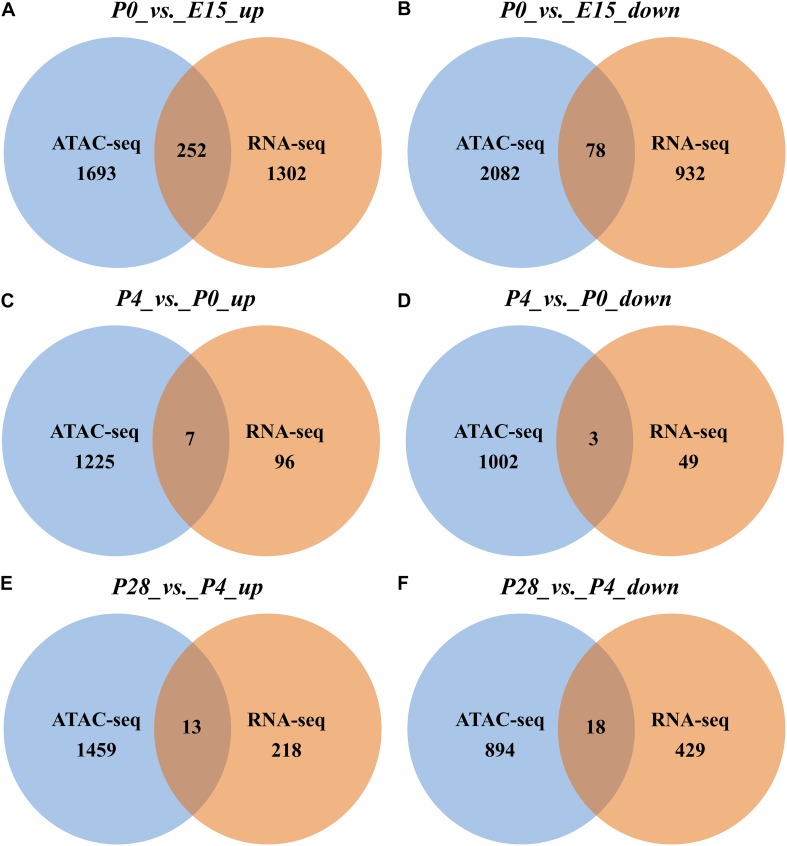
FIGURE 7.
Venn diagrams showing the number of nearby DEGs of differential peaks between different stages of early ovarian development. (A,C,E) Overlap of significantly upregulated genes identified by RNA-seq with nearby genes of significantly increased ATAC-seq peaks between P0 vs. E15, P4 vs. P0, and P28 vs. P4, respectively. (B,D,F) Overlap of significantly downregulated genes identified by RNA-seq with nearby genes of significantly decreased ATAC-seq peaks between P0 vs. E15, P4 vs. P0, and P28 vs. P4, respectively.

