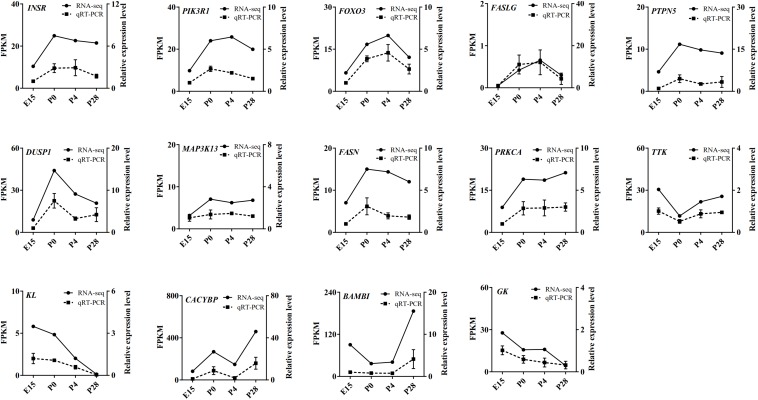
FIGURE 8.
qRT-PCR validation of expression of the main DEGs involving the MAPK signaling, FoxO signaling, cell cycle, lipid metabolism, and Wnt signaling pathways in the geese ovaries during late embryonic and early post-hatching stages. The qRT-PCR results are expressed as the mean ± SEM of 3 pooled ovaries per group and signified by the dashed line, while the RNA-seq data are signified by the solid line.

