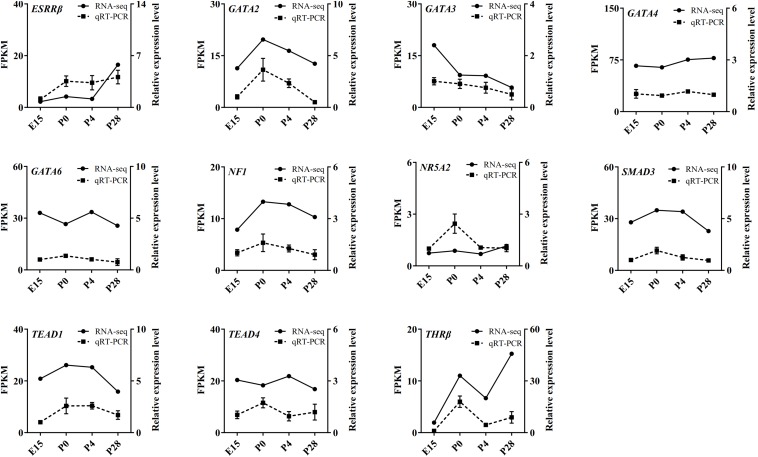
FIGURE 9.
qRT-PCR validation of expression of several transcription factors identified by ATAC-seq in the geese ovaries during late embryonic and early post-hatching stages. The qRT-PCR results are expressed as the mean ± SEM of three pooled ovaries per group and signified by the dashed line, while the RNA-seq data are signified by the solid line.

