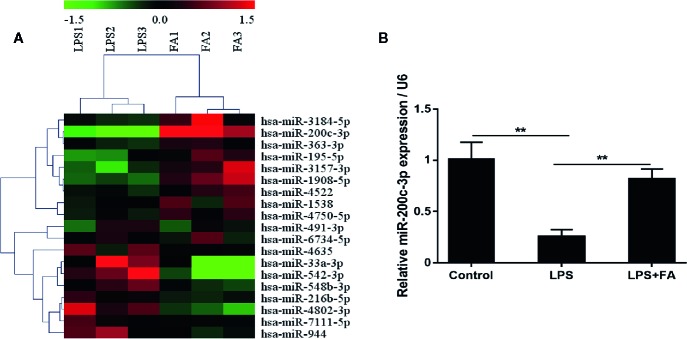
Figure 3.
MiR-200c-3p expression was increased by FA in LPS-induced Caco-2 cells. Cells were pretreated with FA (100 μM) for 2 h and then stimulated with LPS for 24 h. (A) Heat map evaluation of the distinguishable miRNA expression patterns among the LPS and LPS+FA group samples. Each column represents the expression pattern of one sample, and the high expression level and the low expression level are indicated by the “red” and “green” lines, respectively. (B) The expression of miR-200c-3p was measured by qRT-PCR. Data were presented as means ± SD from three independent experiments and differences between means were compared using one-way ANOVA with Tukey’s multiple comparisons test. **P < 0.01.

