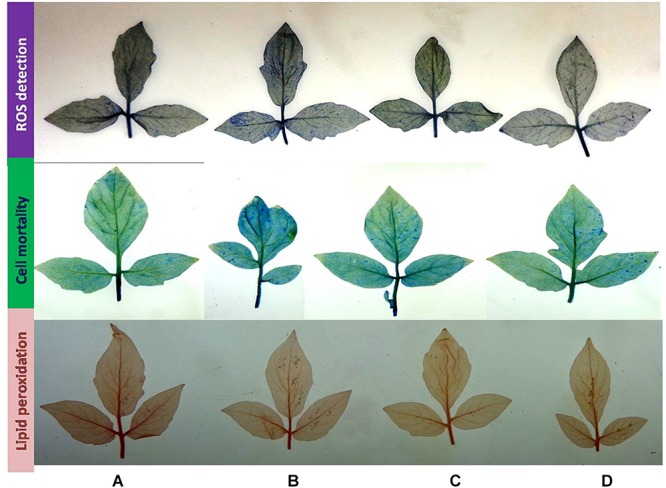
FIGURE 10.

Histochemical analysis of cell death, ROS production, and lipid peroxidation in tomato plant leaves upon bacterial (BHU-AV3) inoculation under salt stress. ROS detection – blue spots show production of superoxide radicals; cell mortality – light blue spots show cell mortality; lipid peroxidation – red spots show lipid peroxidation. (A) Control; (B) salt (NaCl); (C) bacterial (BHU-AV3) inoculation; (D) bacterial inoculation + salt.
