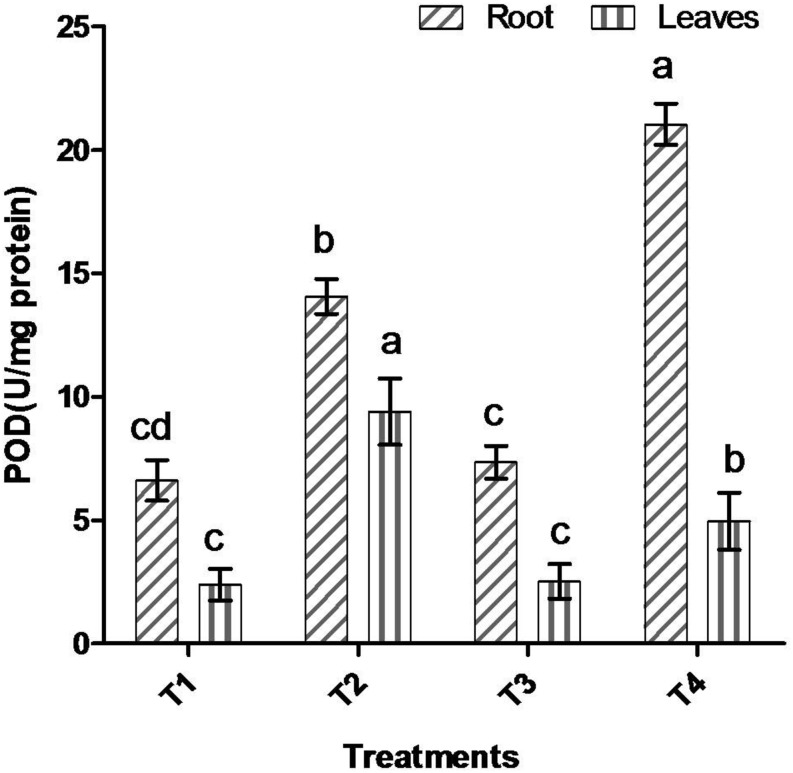
FIGURE 4.
Effect of bacterial (BHU-AV3) inoculation on peroxidase (POD) activity in root and leaves under salt stress. T1 – control, T2 – salt (NaCl), T3 – bacterial (BHU-AV3) inoculation, and T4 – bacterial inoculation + salt. Values represent the mean ± SD, n = 3. Different letters on each bar indicate significant differences (P = 0.05) after DMRT test.

