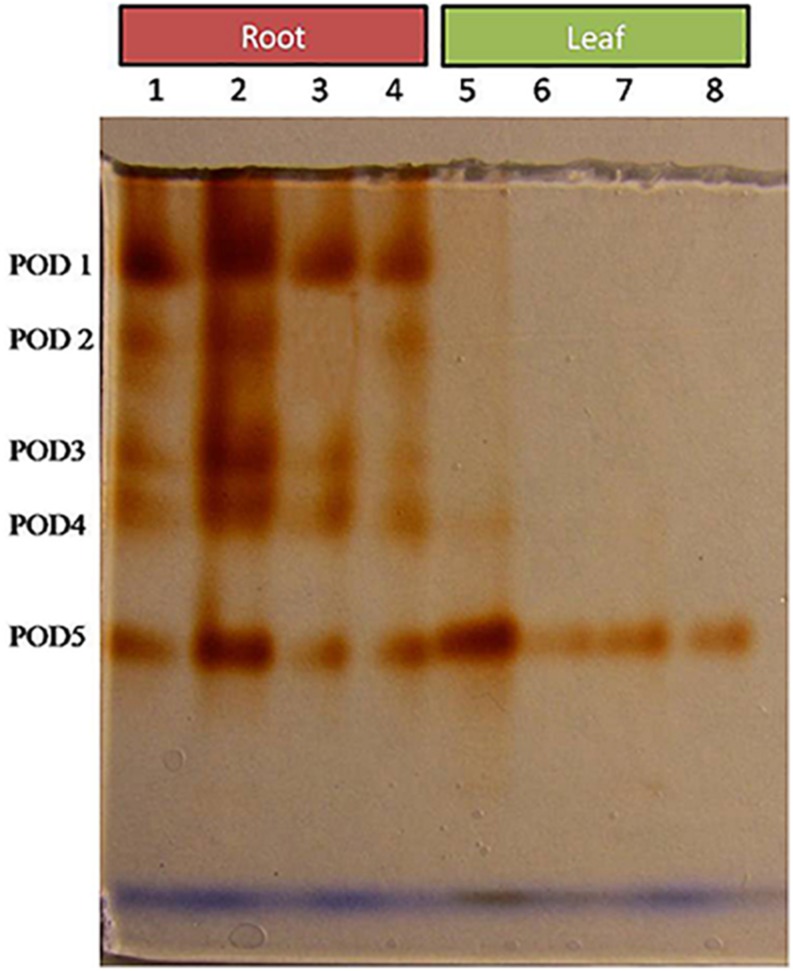
FIGURE 7.
Zymography of POD isoforms expressed in root and leaves upon bacterial (BHU-AV3) inoculation under salt stress. Lanes 1 and 5 – salt treatment; Lanes 2 and 6 – bacterial (BHU-AV3) inoculation + salt; Lanes 3 and 7 – bacterial inoculation; Lanes 5 and 8 – Control. POD 1–5 represents number of isoforms expressed.

