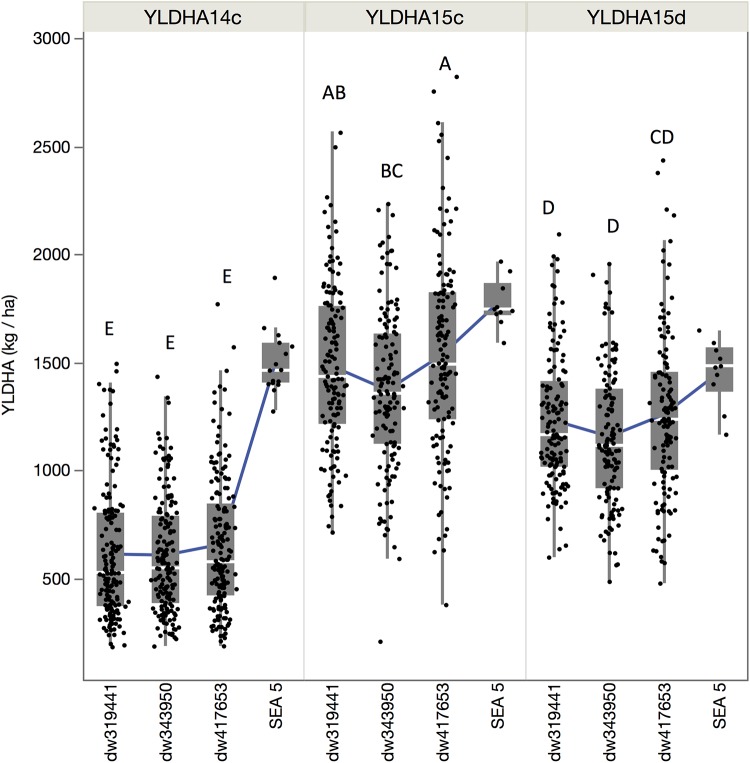
FIGURE 2.
Quantile boxplot and overall mean (green line) of the yield of the three populations and recurrent parent for the three environments: fully irrigated in 2014 (YLDHA14c), fully irrigated in 2015 (YLDHA15c), and terminal drought in 2015 (YLDHA15c). Averages not connected with the same letter are significantly different according to the Tukey-Kramer HSD test (P < 0.05).

