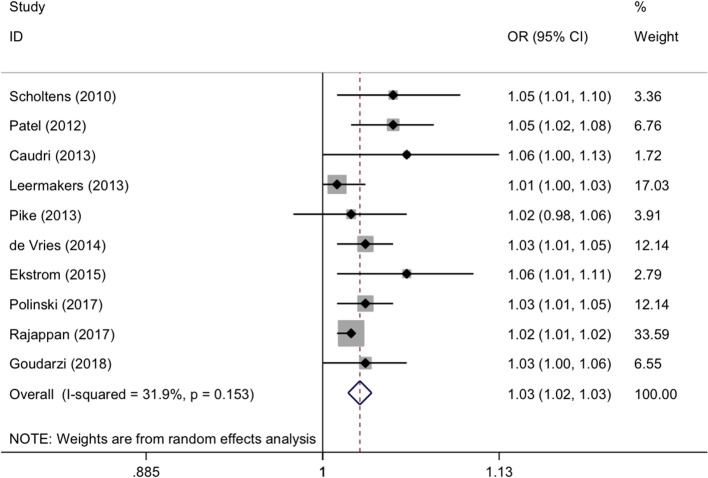
Figure 3.
Forest plots for continuous body mass index after adjustment. OR, odds ratio; 95% CI, 95% confidence interval. The gray shadow size represents the proportion of the weight. The black line equal to 1 perpendicular to the horizontal axis represents an invalid line, and the red dashed line parallel to the black line represents the combined effect line of all the included studies.

