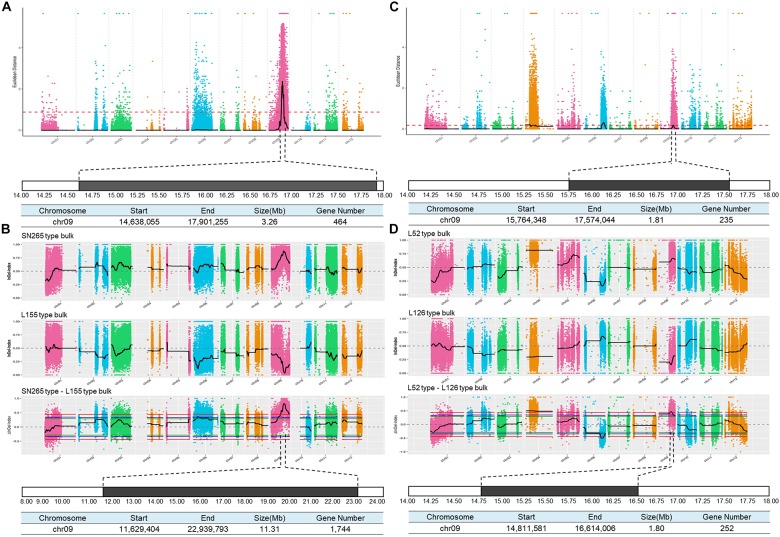
FIGURE 3.
BSA analysis of GS. (A) Identification of the hot-region for GS via ED association analysis of the cross between SN265 and L155. (B) Identification of the candidate gene for GS via the SNP-index method of the cross between SN265 and L155. (C) Identification of the hot-region for GS via ED association analysis of the cross between L126 and L52. (D) Identification of the candidate gene for GS via the SNP-index method of the cross between L126 and L52.

