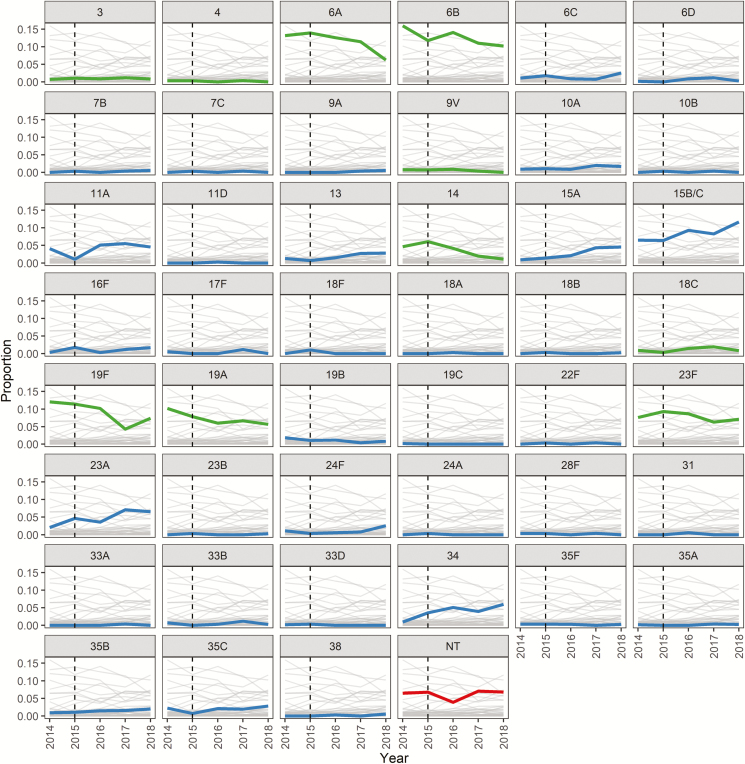
Figure 2.
Pneumococcal serotype colonization, by proportion of total isolates in each time period. Light gray lines show detected serotypes as a proportion of all isolates from that year, with a single serotype highlighted in color (green = vaccine type; blue = nonvaccine type; red = nontypeable [NT]). The vertical black dashed line represents 13-valent pneumococcal conjugate vaccine introduction.

