Figure 1.

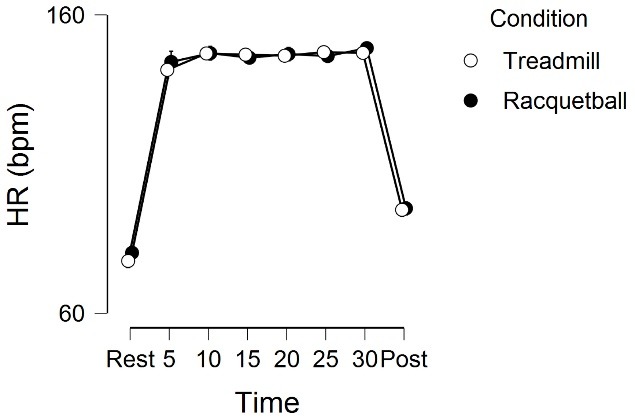
Heart rate responses across the 8 time periods (rest, 5-minute, 10-minute, etc) for the two experimental conditions. Error bars (minimally visible) represent 95% CI.

Heart rate responses across the 8 time periods (rest, 5-minute, 10-minute, etc) for the two experimental conditions. Error bars (minimally visible) represent 95% CI.