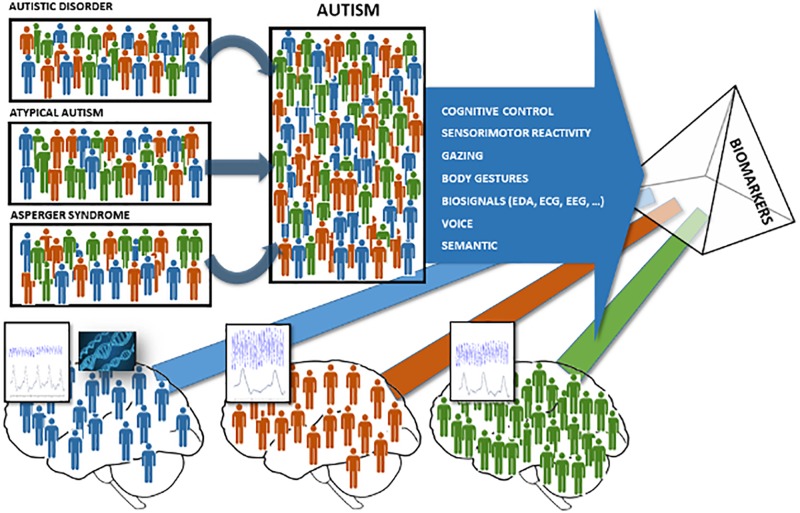
FIGURE 1.
Biomarker models to classify neurodevelopment disorder populations. To the left and center: the three colors (red, blue, and green) represent the possible fault using the qualitative traditional assessment methods to classify the appropriate neurodevelopment disorder well according to the DSM-V. To the right and bottom: the three colors (red, blue, and green) represent the possibility to use biomarkers to quantify and classify neurodevelopment disorder populations with accuracy.

