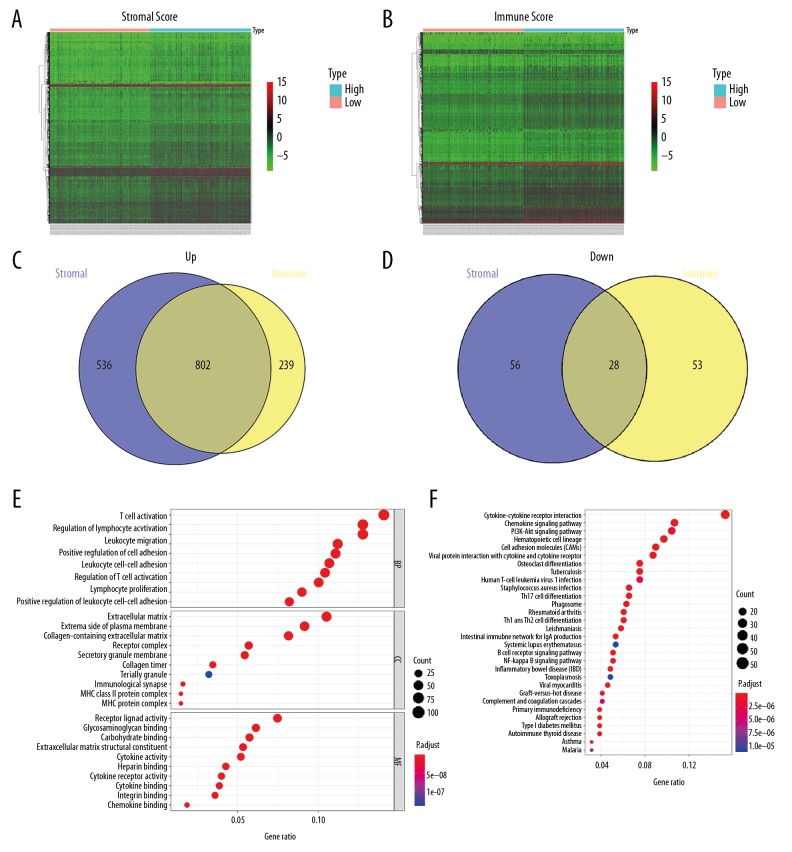
Figure 2.
Comparison of gene expression profile with stromal/immune scores in HCC. (A, B) Heatmap of significantly DEGs on the basis of stromal and immune scores. Red indicates higher expression and green indicates lower expression. (C, D) Venn diagrams displaying the intersection upregulated or downregulated DEGs in high-score groups. (E) Gene ontology analysis of the tumor microenvironment-related genes. (F) Top 30 enriched KEGG pathways for the tumor microenvironment-related genes.

