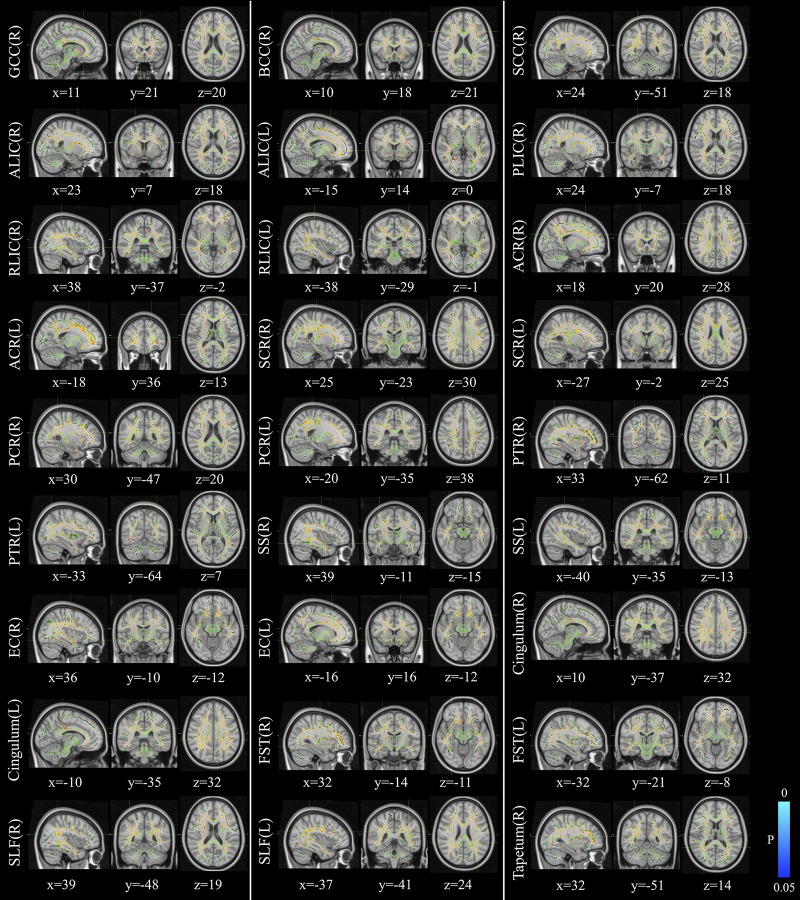
FIGURE 3.
Distribution map of the mean diffusion (MD) value that was significantly higher in the patients group compared with the control group based on the TBSS analysis (red-yellow). Statistical images (pFWE < 0.05 corrected for multiple comparisons) were overlapped onto the mean of the skeleton (green) and the MNI152 template (gray-scale) for visualization. TBSS, tract-based spatial statistics; GCC, genu of corpus callosum; BCC, body of corpus callosum; SCC, splenium of corpus callosum; ALIC, anterior limb of internal capsule; PLIC, posterior limb of internal capsule; RLIC, retrolenticular part of internal capsule; ACR, anterior corona radiate; SCR, superior corona radiate; PCR, posterior corona radiate; PTR, posterior thalamic radiation; SS, sagittal stratum; EC, external capsule; FST, fornix/stria terminalis; SLF, superior longitudinal fasciculus.

