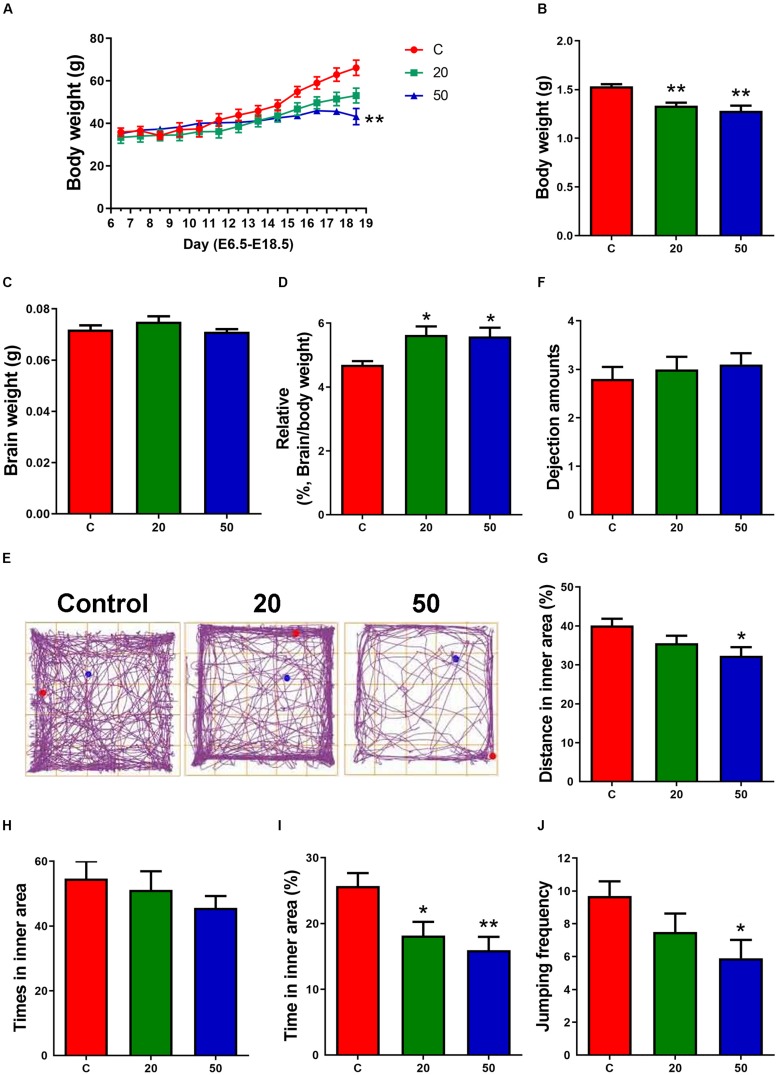
FIGURE 1.
Exposure to gossypol suppressed the body weight of dams, body weights and the ration of brain weight to body weight of offspring. (A) Body weight of dams during E6.5 to E18.5. (B) Body weights of offspring at E18.5. (C) Brain weight of offspring at E18.5. (D) The ratio of brain weight to body weight of offspring at E18.5. (A–D) n = 5 per group. (E) Trace chart of open field test at P21 of offspring. The blue point represents the initial position, and the red point represents the end position. (F–J) Quantitative analysis of dejection amounts, distance, times, time traveled in the inner area, and jumping frequency. n = 10 per group. Difference was found between the control group and gossypol-treated groups. Results are presented as the mean ± SEM. *p < 0.05 and **p < 0.01 compared with the control group. E, embryonic day.

