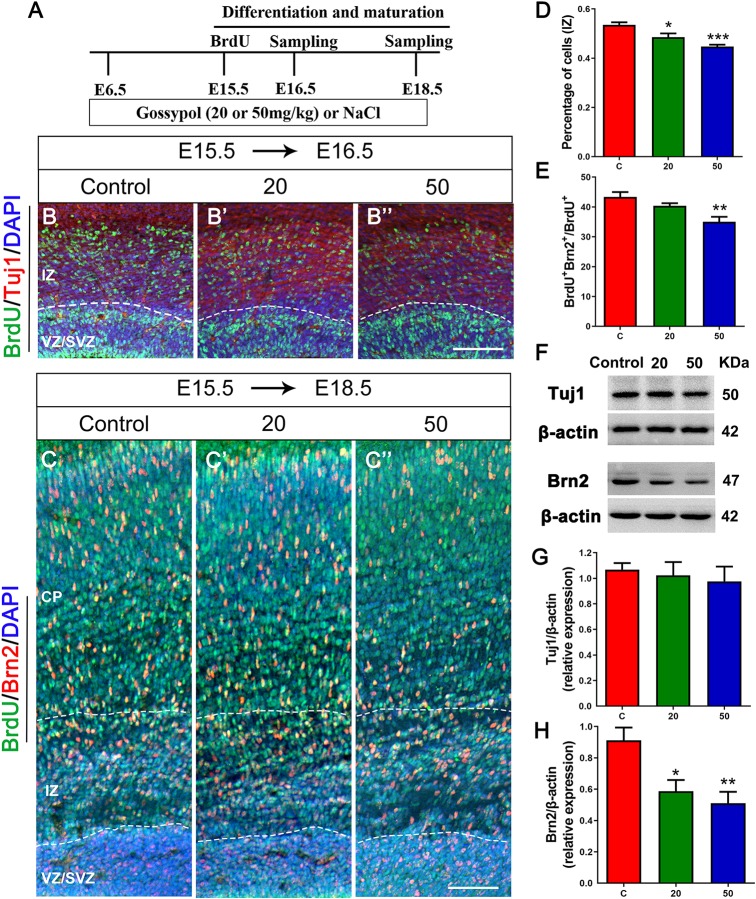
FIGURE 5.
Exposure to gossypol inhibited neuronal differentiation and maturation. (A) Protocol of BrdU injections for testing the neuronal differentiation and maturation. (B) Representative immunofluorescence images of immunostaining for BrdU at E16.5. A single pulse of BrdU was injected at E15.5 and fixed at E16.5. The brain slices were immunostained with antibody against BrdU (green) and counterstained with DAPI (blue). Tuj1 (red) was used to label the IZ of the cerebral cortex. (B) Representative immunofluorescence images of the Brn2+ cells at E18.5. (C) A single pulse of BrdU was injected at E15.5 and fixed at E18.5. The brain slices were immunostained with antibody against BrdU (green) and Brn2 (red), and counterstained with DAPI (blue). (D) Quantification of BrdU labeling cells located in IZ. Less neurons entered the IZ in the gossypol exposure groups. (E) Quantification of BrdU+ Brn2+ positive cells in the total number of BrdU+ cells. Less cells differentiated into neurons at E18.5 in gossypol exposure groups. (F) Representative Western blots of Tuj1, Brn2 and β-actin are shown and densitometry was used to quantify the protein levels in the developmental cerebral cortex. (G,H) Relative protein levels of Tuj1 (G) at E16.5 and Brn2 (H) at E18.5, the expression of Brn2 was decreased after the treatment of gossypol. Results are presented as the mean ± SEM (n = 5 per group). Scale bars 100 μm. *p < 0.05, **p < 0.01 and ***p < 0.001 compared with the control group. E, embryo; CP, cortical plate; IZ, intermediate zone; VZ/SVZ, ventricular zone/subventricular zone. Dashed lines indicate cortex boundaries.

