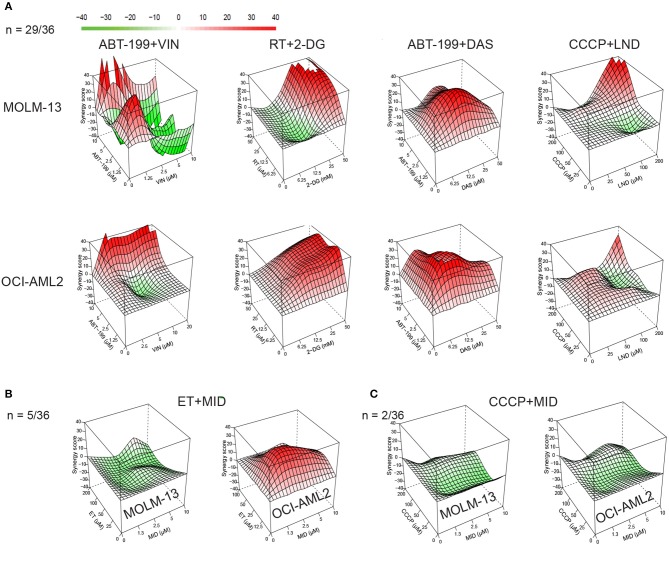
Figure 2.
Synergy landscapes for mitocan-based AML drug combinations. Drug combination landscapes were built using Bioconductor package “synergyfinder.” One representative replicate (with maximal synergy closest to its average value) is shown. (A) Examples of drug combinations (n = 29/36), synergistic against AML cell lines. Shown are drug combinations having highest (>70) cumulative synergy against MOLM-13 (top) and OCI-AML2 (bottom) cells. (B) Example of drug combination with opposite profiles in MOLM-13 and OCI-AML2 (n = 5/36). (C) Examples of antagonistic drug combinations for MOLM-13 (left) and OCI-AML2 (right) cells (n = 2/36). Drug combination landscapes: z-axis, synergy score (ranges from −40, green, to +40, red); x/y-axes, drug1/drug2 concentration range, respectively. For specific drug names and drug concentrations, refer to Table S4.

