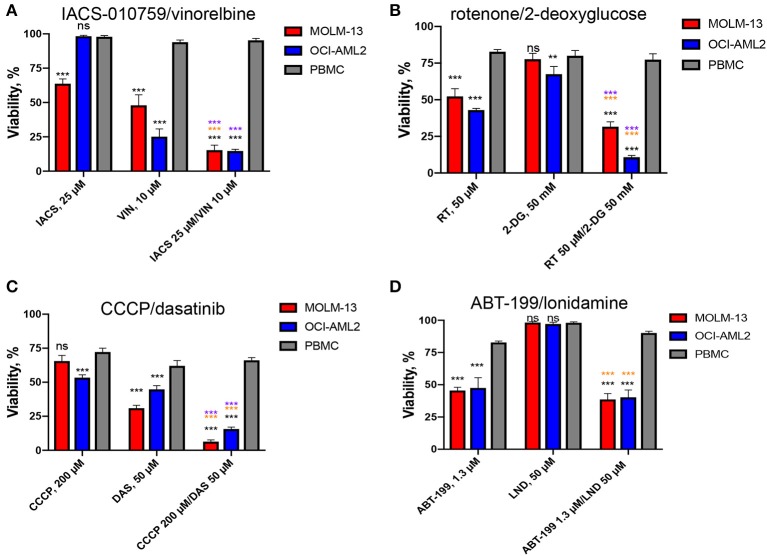
Figure 4.
Effect of top selective drug combinations and corresponding single drugs on AML cell lines and healthy PBMCs. Survival of MOLM-13, OCI-AML2, or healthy PBMCs following single and combinatorial treatments with dosages corresponding to the maximal average difference in survival of AML vs. PBMCs. (A) IACS-010759/vinorelbine, (B) rotenone/2-deoxy-D-glucose, (C) CCCP/dasatinib, (D) ABT-199/lonidamine. Shown are the mean from at least three independent biological replicates (mean ± SEM). Significance of changes in survival was assessed via Student's t-test. ***p < 0.001; **p < 0.01; ns: p > 0.05. Black stars or ns indicate comparison of AML cells vs. healthy PBMCs under the same treatment condition; purple stars indicate significantly lower survival under combinatorial treatment compared to single mitocan for each cell line; orange stars indicate significantly lower survival under combinatorial treatment compared to single complementary drug for each cell line.

