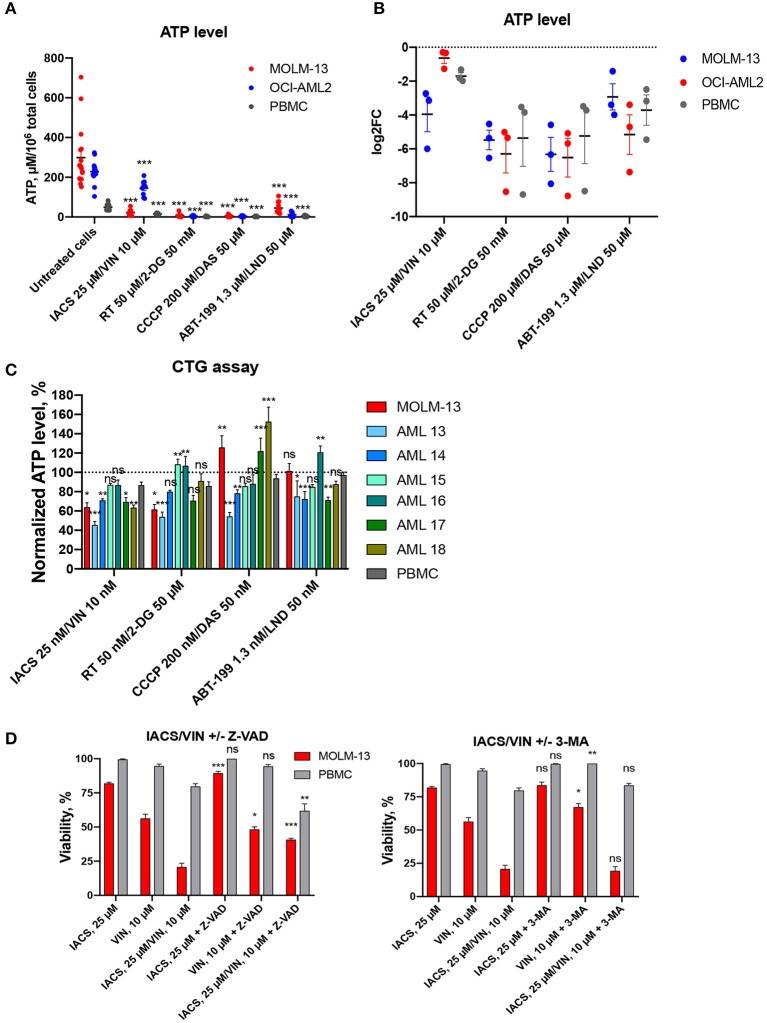
Figure 6.
Treatment-induced changes in ATP level and activation of cell death. Absolute (A) or relative (B) ATP levels following 16 h treatment with DMSO or four selected drug combinations (IACS-010759/vinorelbine, rotenone/2-deoxy-D-glucose, ABT-199/lonidamine, or CCCP/dasatinib). Shown are mean ± SEM from at least three independent biological replicates. Significance of changes in ATP in treated vs. untreated cells for each cell line or PBMCs was assessed via Student's t-test. ***p < 0.001. (C) ATP levels, obtained with CellTiter-GloR assay and normalized to DMSO control (shown as y = 100), following treatment for 2 h with 1/1,000 doses corresponding to maximal selectivity of drug combinations in AML cells (MOLM-13 or primary AML samples), or healthy PBMCs. Shown are the means from 1 to 3 independent biological replicates (mean ± SEM). Significance of difference in AML vs. PBMCs was assessed via Student's t-test. (D) Changes in cellular viability after IACS-010759/vinorelbine or corresponding single drug treatment with or without addition of cell death inhibitors: Z-VAD, 40 μM, left; 3-MA, 5 mM, right. Shown are the means from three independent biological replicates (mean ± SEM). Significance of difference in survival with and without inhibitor was assessed via Student's t-test. ***p < 0.001; **p < 0.01; *p < 0.05; ns: p > 0.05.

