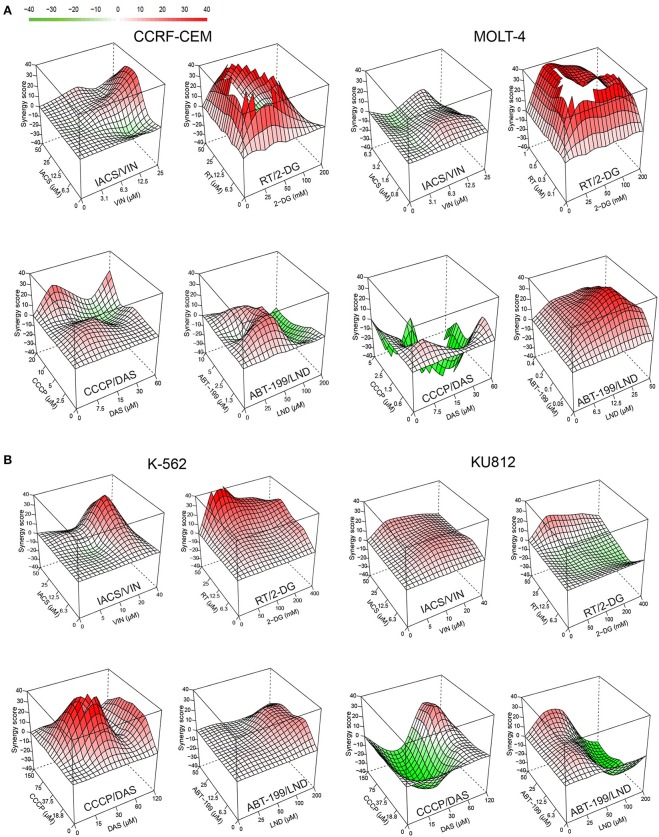
Figure 8.
Effect of selected mitocan-based drug combinations on other types of leukemia. (A,B) Synergy landscapes for ALL, (A) (CCRF-CEM cells, left, or MOLT-4 cells, right) or CML, (B) (K-562 cells, left, or KU812 cells, right) treated with IACS-010759/vinorelbine, rotenone/2-deoxy-D-glucose, CCCP/dasatinib, or ABT-199/lonidamine. Drug combination landscapes: z-axis, synergy score (ranges from −40, green, to +40, red); x/y-axes, drug1/drug2 concentration range, respectively. Drug combination landscapes were built using Bioconductor package “synergyfinder.” One representative replicate (with maximal synergy closest to the average value of three biological replicates) is shown. For specific drug names and drug concentrations, refer to Table S4.

